Reason to trust
How Our News is Made
Strict editorial policy that focuses on accuracy, relevance, and impartiality
Ad discliamer
Morbi pretium leo et nisl aliquam mollis. Quisque arcu lorem, ultricies quis pellentesque nec, ullamcorper eu odio.
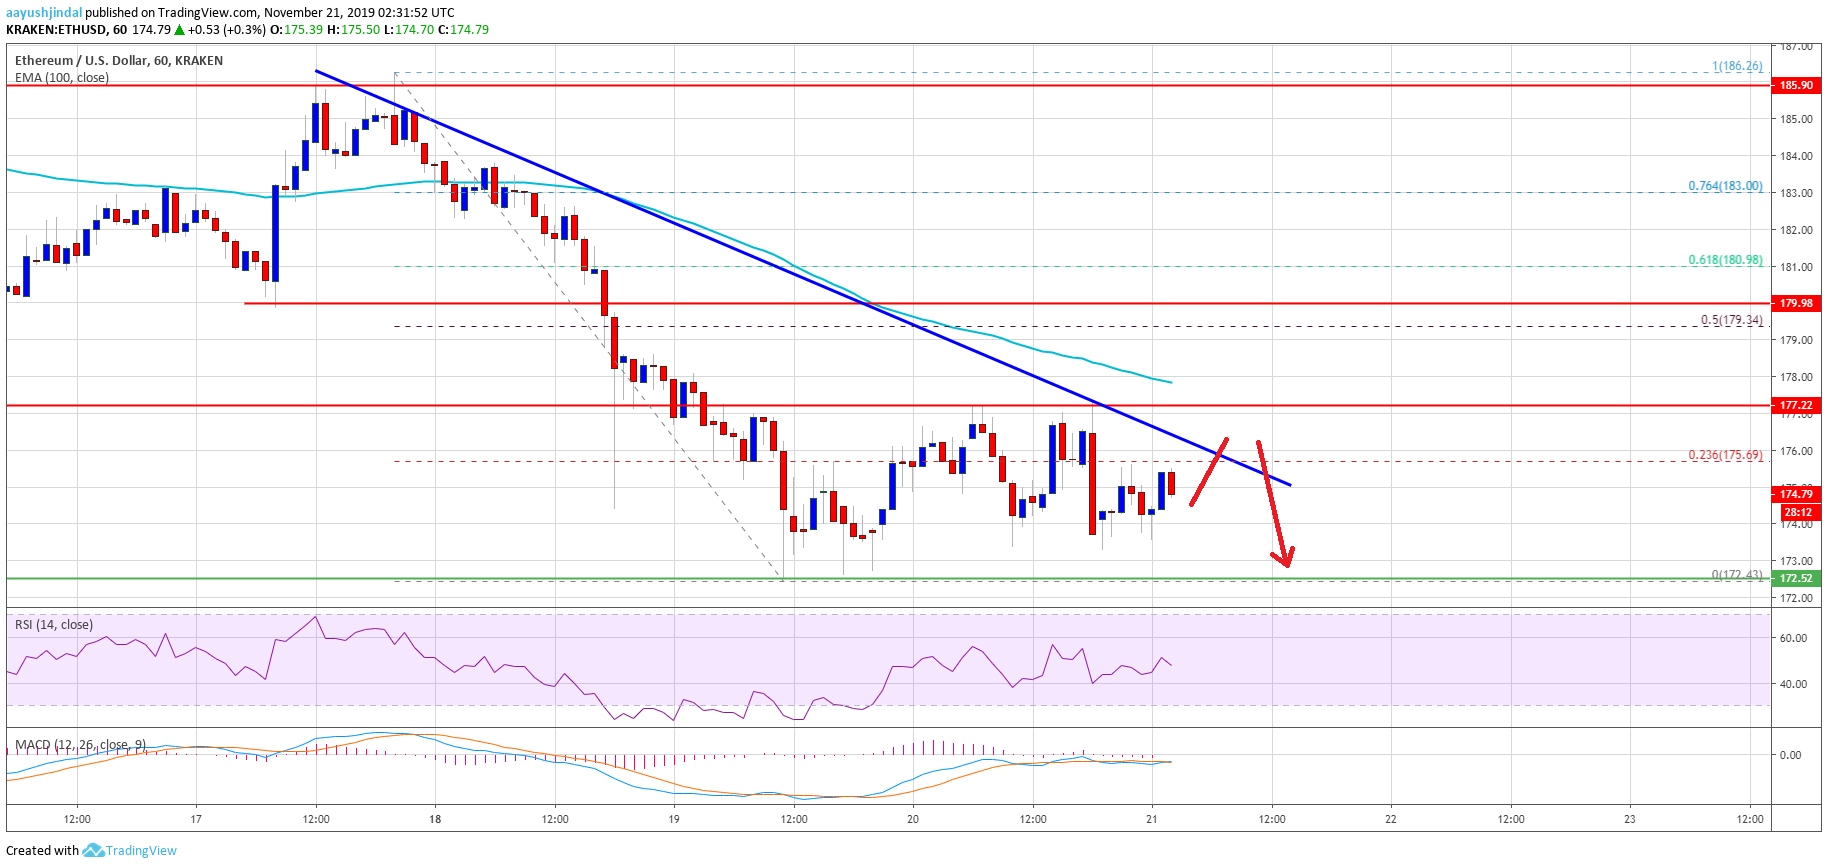
- Ethereum is currently consolidating losses above the $172 support against the US Dollar.
- Bitcoin price is also consolidating above the key $8,000 support area.
- There is a new connecting bearish trend line forming with resistance near $176 on the hourly chart of ETH/USD (data feed via Kraken).
- The price is likely to continue lower as long as it is below the $180 resistance.
Ethereum price is showing signs of bearish continuation versus the US Dollar, similar to bitcoin. ETH bears seem to be eyeing a test of $164 or even $160.
Ethereum Price Analysis
Recently, there was a downside break in Ethereum below the $180 support against the US Dollar. Moreover, ETH price settled below the $178 support and the 100 hourly simple moving average.
Later, it found support near the $172 level and started an upside correction. There was a break above the $175 resistance area. However, the upward move was capped by the $177-$178 resistance area.
Additionally, the price failed to stay above the 23.6% Fib retracement level of the last key decline from the $186 high to $172 low. At the outset, the price is consolidating above the $172 support and facing many hurdles near $176.
More importantly, there is a new connecting bearish trend line forming with resistance near $176 on the hourly chart of ETH/USD. Above the trend line resistance, the 100 hourly simple moving average is near the $178 level to act as a resistance.
Besides, the main resistance is near the $180 level. It coincides with the 50% Fib retracement level of the last key decline from the $186 high to $172 low. Therefore, Ethereum price must break the $178 and $180 resistance levels to start a decent recovery.
Conversely, the price could struggle to recover and continue lower below $172. If there is a downside break below the $172 support, the price is likely to accelerate lower towards the $166 and $164 support levels.
The main support is near the $160 area, where the bulls are likely to take a stand. Any further losses may perhaps push the price towards the $154 level.
Looking at the chart, Ethereum price is showing a lot of bearish signs below the $178 and $180 resistance levels. Therefore, there remains a risk of more downsides below the $172 support area. Only a close above $180 might negate the bearish view and start a decent recovery in the near term.
ETH Technical Indicators
Hourly MACD – The MACD for ETH/USD is currently flat in the bearish zone.
Hourly RSI – The RSI for ETH/USD is currently struggling to settle above the 50 level.
Major Support Level – $172
Major Resistance Level – $180