
Reason to trust
How Our News is Made
Strict editorial policy that focuses on accuracy, relevance, and impartiality
Ad discliamer
Morbi pretium leo et nisl aliquam mollis. Quisque arcu lorem, ultricies quis pellentesque nec, ullamcorper eu odio.
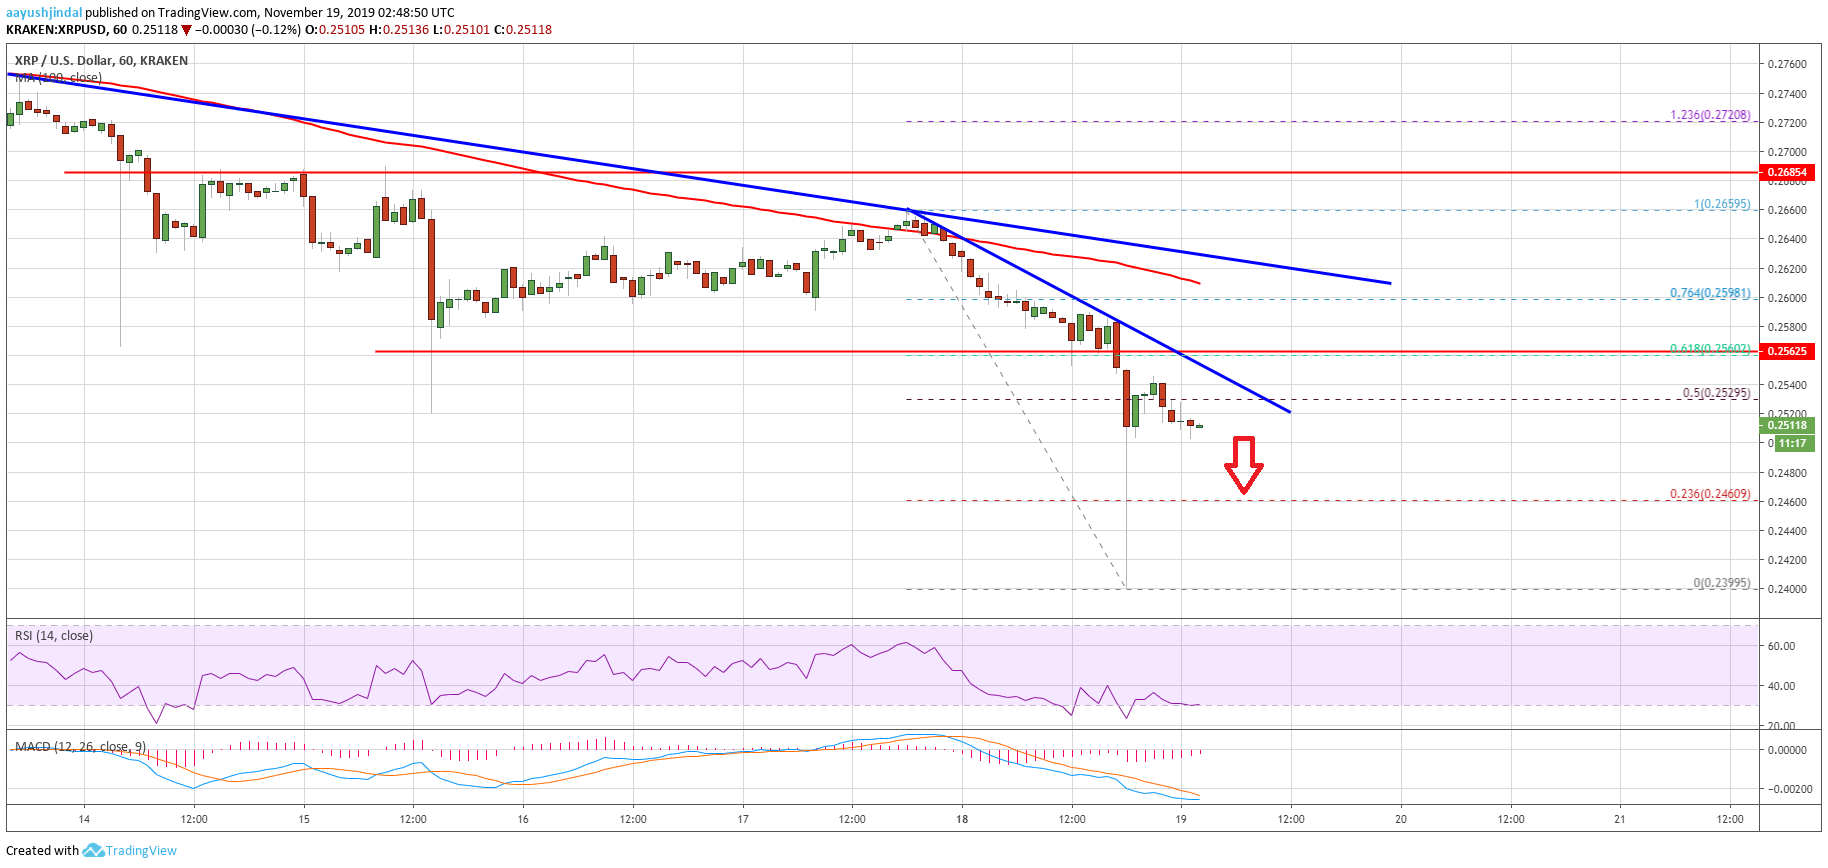
- Ripple price is declining and trading below the $0.2560 pivot level against the US dollar.
- Bitcoin is down more than 3% today and Ethereum broke a major support near $178.
- There is a new connecting bearish trend line forming with resistance near $0.2530 on the hourly chart of the XRP/USD pair (data source from Kraken).
- The price tumbled recently and tested the $0.2400 support area.
Ripple price is trading in a crucial downtrend against the US Dollar, while bitcoin is approaching $8K. XRP price is likely to struggle near the $0.2560 and $0.2600 resistances.
Ripple Price Analysis
After forming an intermediate top near the $0.2660 level, ripple declined heavily against the US Dollar. XRP/USD broke many key supports near $0.2560 to move further into a bearish zone.
Moreover, there was a close below the $0.2560 level and the 100 hourly simple moving average. It opened the doors for more losses and the price declined heavily below the $0.2500 level.
The recent decline gained pace below the $0.2450 level and ripple tested the $0.2400 support area (as discussed in yesterday’s analysis). A new monthly low was formed near $0.2399 and the price is currently correcting higher.
It is testing the 50% Fib retracement level of the recent decline from the $0.2659 high to $0.2399 low. On the upside, there are many resistances near the $0.2540 and $0.2560 levels.
Besides, there is a new connecting bearish trend line forming with resistance near $0.2530 on the hourly chart of the XRP/USD pair. Above the trend line, ripple price is likely to struggle near the $0.2580 level and the 100 hourly simple moving average.
More importantly, the 76.4% Fib retracement level of the recent decline from the $0.2659 high to $0.2399 low is likely to act as a strong resistance. Finally, yesterday’s highlighted bearish trend line is intact with resistance near $0.2620 on the same chart.
On the downside, an immediate support is near the $0.2480 level. If the price starts a fresh decline below $0.2480, it is likely to test the $0.2420 and $0.2400 levels. Any further downsides depend whether bitcoin breaks the $8,000 support and continue lower.
Looking at the chart, ripple price is clearly gaining bearish momentum below $0.2560. In the short term, there could be an upside correction, but the overall trend remains bearish as long as the price is trading below the $0.2700 level.
Technical Indicators
Hourly MACD – The MACD for XRP/USD is slowly reducing its bearish slope.
Hourly RSI (Relative Strength Index) – The RSI for XRP/USD is now well below the 40 level, with a bearish angle.
Major Support Levels – $0.2480, $0.2420 and $0.2400.
Major Resistance Levels – $0.2560, $0.2580 and $0.2620.