
Reason to trust
How Our News is Made
Strict editorial policy that focuses on accuracy, relevance, and impartiality
Ad discliamer
Morbi pretium leo et nisl aliquam mollis. Quisque arcu lorem, ultricies quis pellentesque nec, ullamcorper eu odio.
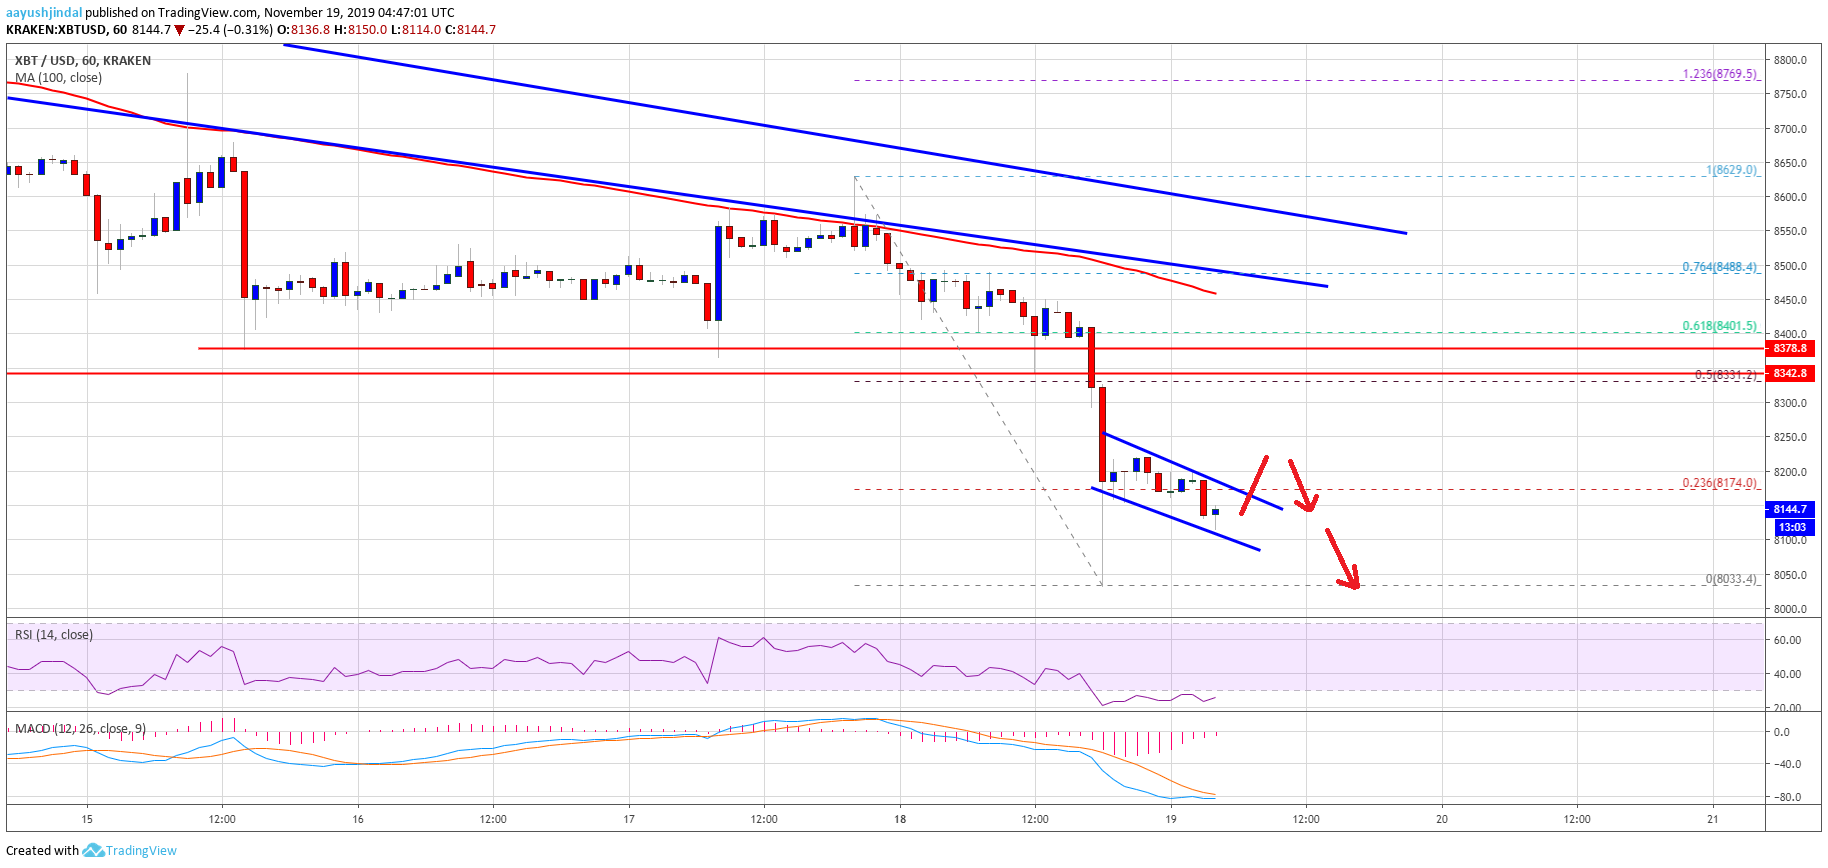
- Bitcoin price is diving below the $8,340 and $8,200 support levels against the US Dollar.
- The price is approaching the key $8,000 support area, where the bulls may take a stand.
- There is a short term declining channel forming with resistance near $8,165 on the hourly chart of the BTC/USD pair (data feed from Kraken).
- Both Ethereum and ripple are gaining bearish momentum below key supports.
Bitcoin price is declining towards the $8,000 support against the US Dollar. If BTC fails to stay above $8,000, the next stop could be near the $7,650 level.
Bitcoin Price Analysis
Yesterday, we discussed the chances of a breakdown in bitcoin towards the $8,200 support against the US Dollar. BTC did decline in the past three sessions and broke the $8,340 and $8,320 support levels.
Moreover, the price failed to stay above the key $8,200 support level and settled well below the 100 hourly simple moving average. It traded close to the $8,000 level and a new monthly low was formed near $8,033.
At the moment, the price is correcting higher above the $8,100 level. It is consolidating near the 23.6% Fib retracement level of the recent slide from the $8,630 swing high to $8,033 low.
On the upside, an immediate resistance is near the $8,180 and $8,200 levels. Besides, there is a short term declining channel forming with resistance near $8,165 on the hourly chart of the BTC/USD pair.
It bitcoin climbs above the channel resistance, it could test the $8,300 and $8,320 resistance levels. The previous major support near $8,320 is now likely to act as a crucial resistance for bitcoin. Additionally, the 50% Fib retracement level of the recent slide from the $8,630 swing high to $8,033 low is near the $8,330 level.
The main downtrend resistance is now near $8,450, $8,560, a couple of bearish trend lines, and the 100 hourly simple moving average. Therefore, a daily close above the $8,560 resistance is needed to start a decent recovery in the near term.
On the other hand, the price could continue to move down towards $8,000. Furthermore, if there is a downside break below the $8,000 support, the bulls are likely to give up. The next major support is seen near the $7,650 level.
Looking at the chart, bitcoin price is clearly trading in a strong downtrend below the $8,320 and $8,560 resistance levels. Thus, it remains a sell until there is a daily close above $8,560.
Technical indicators:
Hourly MACD – The MACD is losing pace in the bearish zone.
Hourly RSI (Relative Strength Index) – The RSI for BTC/USD is currently moving in the oversold area.
Major Support Levels – $8,000 followed by $7,650.
Major Resistance Levels – $8,200, $8,320 and $8,450.


