
Reason to trust
How Our News is Made
Strict editorial policy that focuses on accuracy, relevance, and impartiality
Ad discliamer
Morbi pretium leo et nisl aliquam mollis. Quisque arcu lorem, ultricies quis pellentesque nec, ullamcorper eu odio.
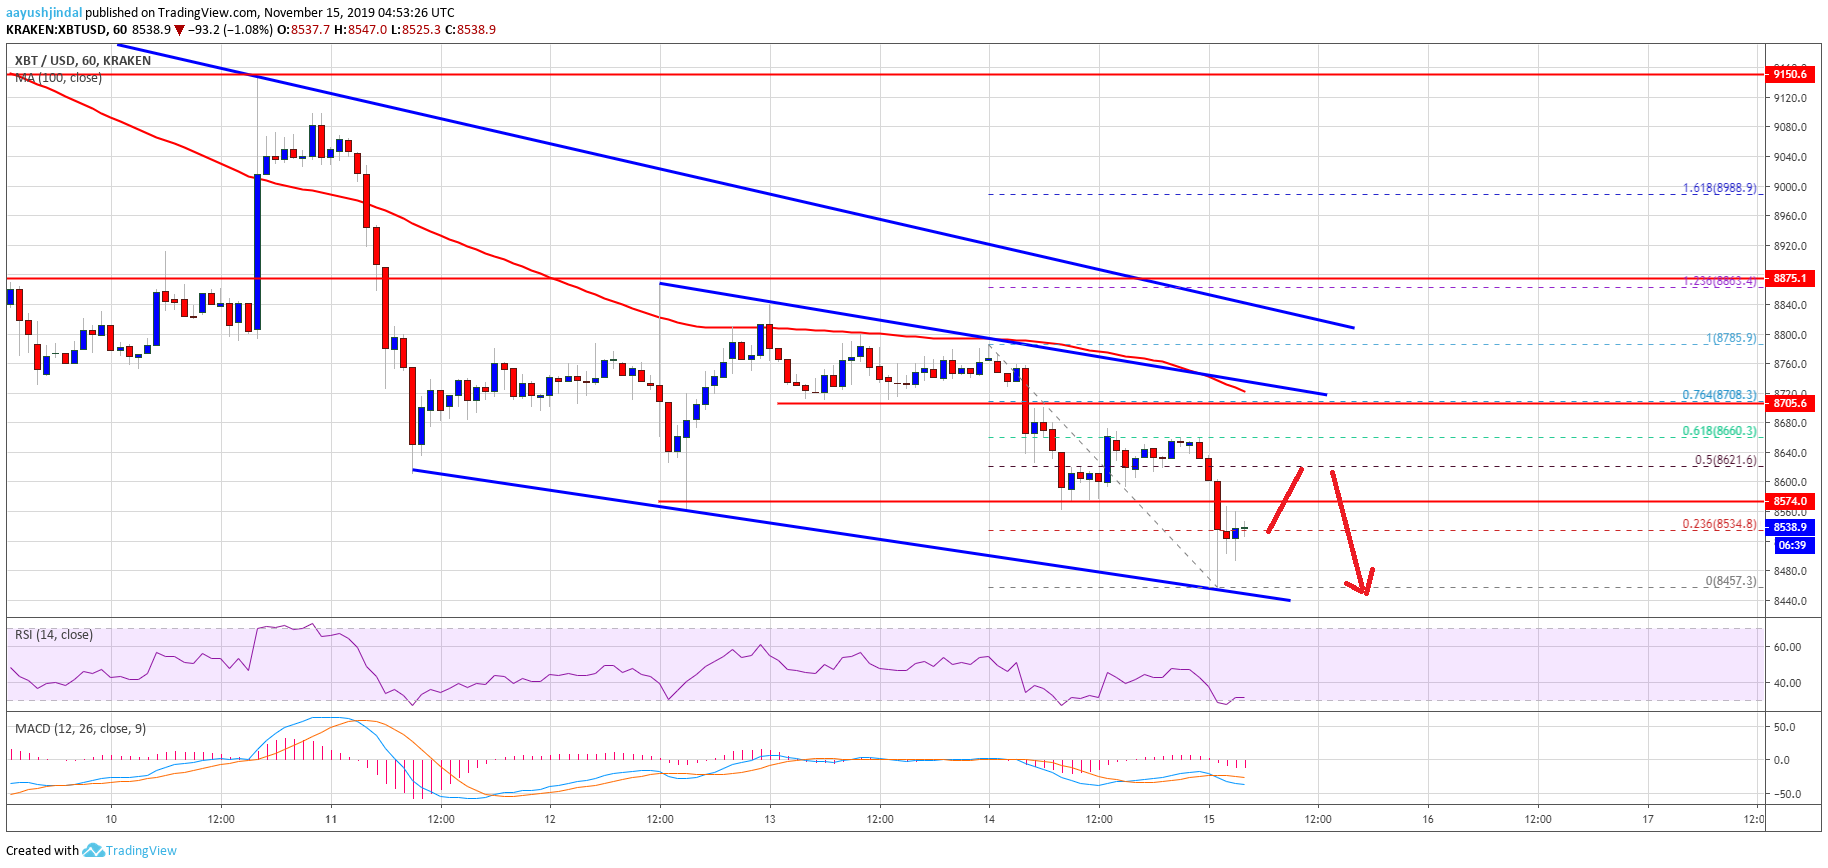
- Bitcoin price is currently declining below the $8,600 support area against the US Dollar.
- A new monthly low was formed near $8,457 and the price is currently correcting higher.
- There is a key declining channel forming with resistance near $8,710 on the hourly chart of the BTC/USD pair (data feed from Kraken).
- There is a risk of more downsides as long as the price is below $8,700 and $8,880.
Bitcoin price is gaining bearish momentum below $8,700 against the US Dollar. Therefore, BTC could continue to move down towards the next support near $8,300 and $8,200.
Bitcoin Price Analysis
In the past few sessions, there was a steady decline below the $8,800 level in bitcoin against the US Dollar. BTC broke the $8,750 and $8,700 levels to move further into a bearish zone.
Moreover, there was a break below the $8,600 support area and the price settled well below the 100 hourly simple moving average. Finally, the price broke the $8,550 and $8,500 support levels.
A new monthly low was formed near $8,457 and the price is currently consolidating losses. Besides, it is trading near the 23.6% Fib retracement level of the recent decline from the $8,785 high to $8,457 low.
On the upside, an immediate resistance is near the $8,580 and $8,600 levels. The first key resistance for bitcoin is near the $8,620 level. Additionally, it coincides with the 50% Fib retracement level of the recent decline from the $8,785 high to $8,457 low.
More importantly, there is a key declining channel forming with resistance near $8,710 on the hourly chart of the BTC/USD pair. To move into a positive zone, the price must break the $8,700 and $8,800 resistance levels.
The main resistance is near $8,880, above which the price is likely to accelerate higher towards the $9,000 and $9,200 levels. On the downside, an initial support is near the $8,450 level.
If there is another break down below the $8,450 level, the price may perhaps continue to move down below $8,400. The next major support is near the $8,300 and $8,200 levels, where the bulls are likely to appear.
Looking at the chart, bitcoin is clearly trading in a slow and steady decline below $8,700 and $8,800. Thus, there are high chances of more losses below the $8,500 and $8,450 levels. Conversely, a break above $8,700 might start a decent recovery in the near term.
Technical indicators:
Hourly MACD – The MACD is currently gaining momentum in the bearish zone.
Hourly RSI (Relative Strength Index) – The RSI for BTC/USD is currently correcting higher, but it is well below 50 level.
Major Support Levels – $8,450 followed by $8,300.
Major Resistance Levels – $8,620, $8,700 and $8,800.


