
Reason to trust
How Our News is Made
Strict editorial policy that focuses on accuracy, relevance, and impartiality
Ad discliamer
Morbi pretium leo et nisl aliquam mollis. Quisque arcu lorem, ultricies quis pellentesque nec, ullamcorper eu odio.
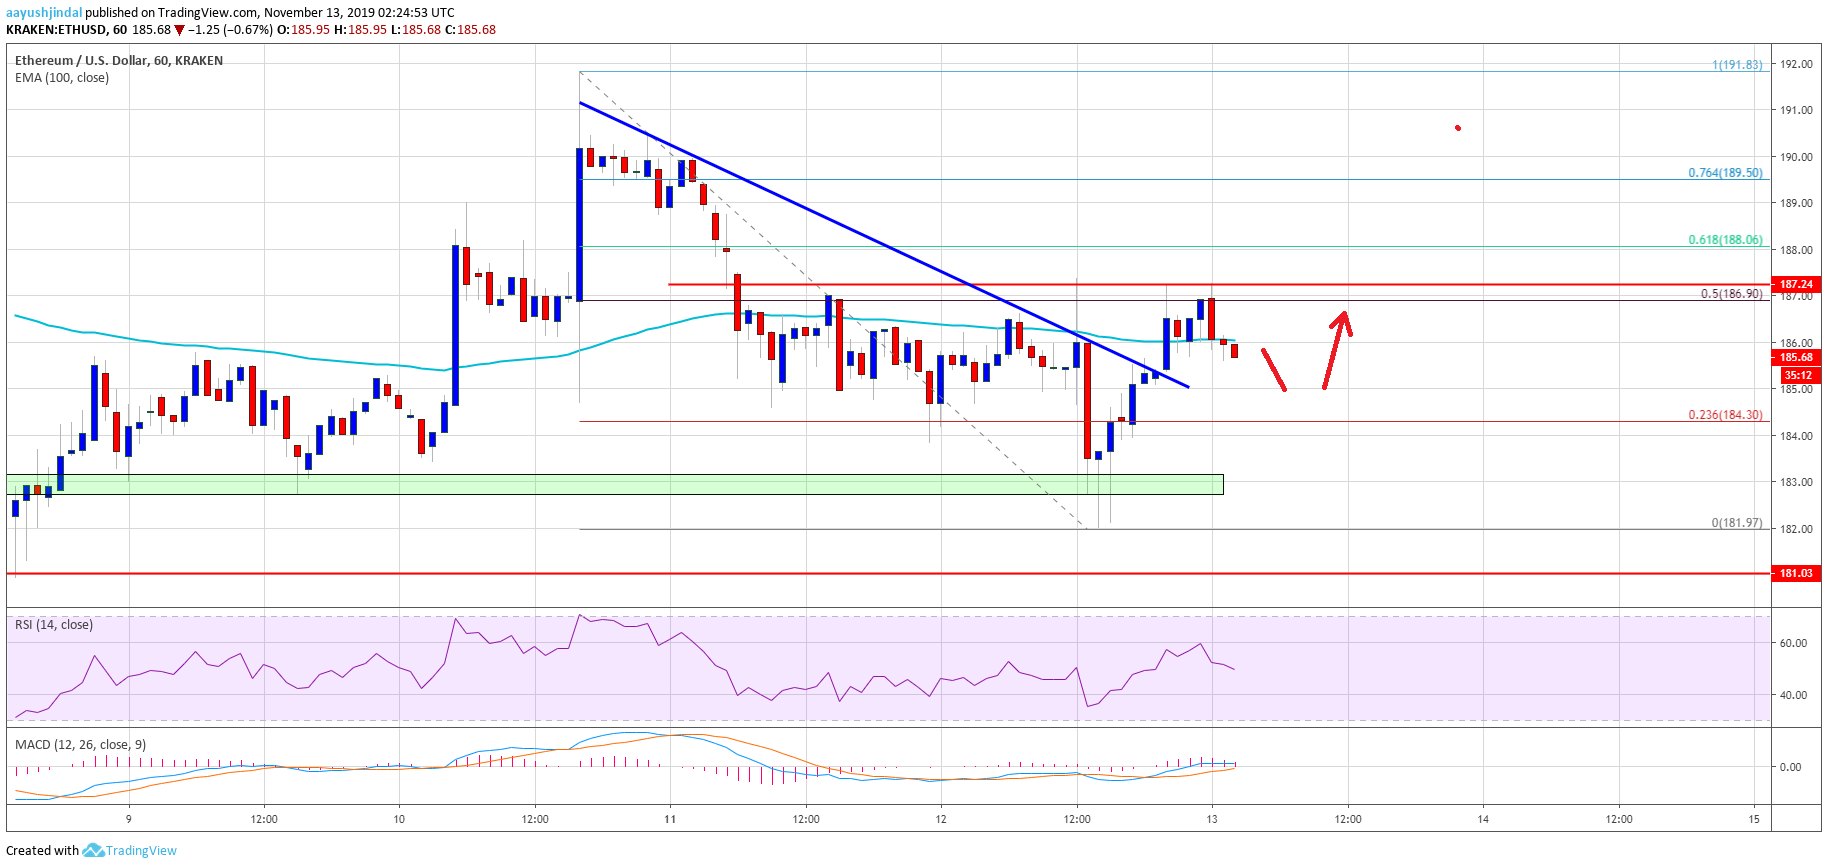
- Ethereum price is trading nicely above the key $182 and $180 support levels against the US Dollar.
- The price is currently facing many resistances such as $187, $188 and $190.
- Recently, there was a break above a connecting bearish trend line with resistance near $185 on the hourly chart of ETH/USD (data feed via Kraken).
- Bitcoin is holding the $8,650 support, but it remains at a risk of more downsides.
Ethereum price is still stuck in a broad range versus the US Dollar, while bitcoin is facing selling pressure. ETH price might recover higher unless the bulls fail near $180.
Ethereum Price Analysis
In the past three sessions, there were mostly range moves in Ethereum above the $182 support against the US Dollar. ETH tested the $182 support recently, settled below the 100 hourly simple moving average, and it is currently recovering higher.
It corrected above the 23.6% Fib retracement level of the downward move from the $192 swing high to $182 low. Moreover, there was a break above a connecting bearish trend line with resistance near $185 on the hourly chart of ETH/USD.
However, the price faced a strong resistance near the $187 level. It represents the 50% Fib retracement level of the downward move from the $192 swing high to $182 low.
At the outset, Ethereum is trading with a bearish angle below $187 and the 100 hourly SMA. It might continue to decline, but there are many supports on the downside, starting with $184.
The next key support is near the $182 area, where the bulls are likely to take a stand. To push the price further into a bearish zone, the bears need to gain pace below the $182 and $180 support levels.
On the upside, the $187 level and the 100 hourly SMA are initial hurdles. A convincing break above the $187 and $188 resistance levels could push the price towards the $192 high.
Finally, a clear break above the $192 level is must for upside continuation. The next key resistance are near the $198 and $200 levels, above which it could test $205.
Looking at the chart, Ethereum price is showing a few positive signs, but it is facing a lot of hurdles such as $187, $188 and $190. On the downside, the $182 and $180 support levels hold the key. If there is a breakdown below $180, the price may perhaps decline towards $168.
ETH Technical Indicators
Hourly MACD – The MACD for ETH/USD is struggling to gain strength in the bullish zone.
Hourly RSI – The RSI for ETH/USD is currently declining and it is now just below the 50 level.
Major Support Level – $182
Major Resistance Level – $188