
Reason to trust
How Our News is Made
Strict editorial policy that focuses on accuracy, relevance, and impartiality
Ad discliamer
Morbi pretium leo et nisl aliquam mollis. Quisque arcu lorem, ultricies quis pellentesque nec, ullamcorper eu odio.
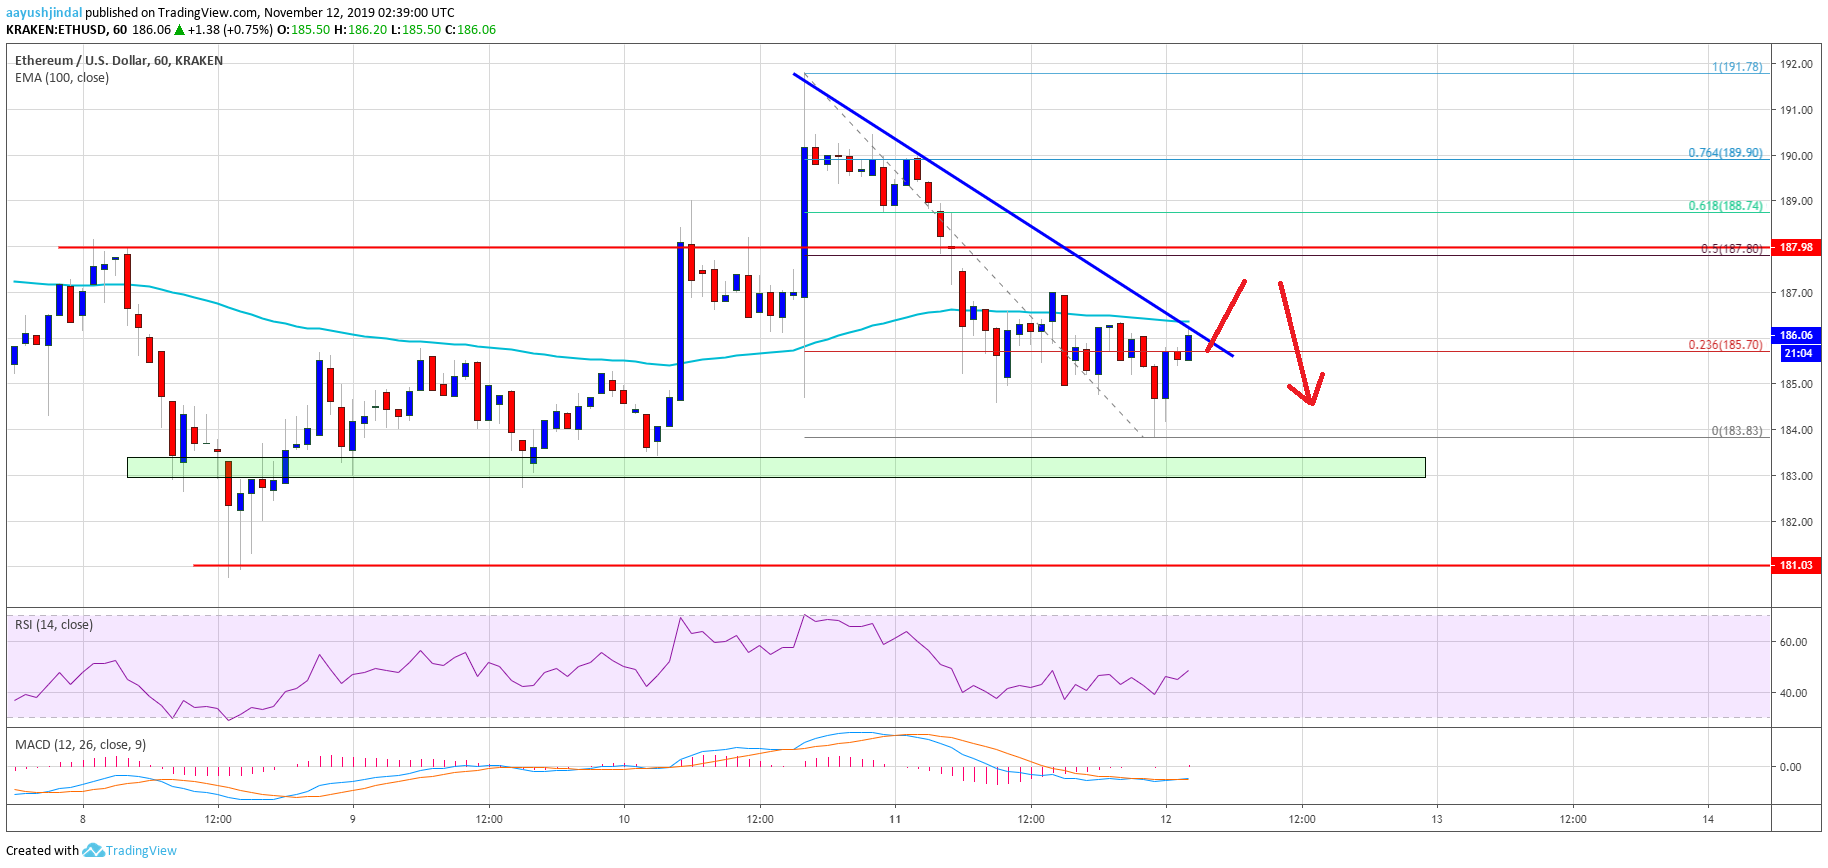
- Ethereum price failed to continue above $190 and declined below $188 against the US Dollar.
- The price is currently correcting higher, but it is likely to face resistance near $187-$188.
- There is a connecting bearish trend line forming with resistance near $187 on the hourly chart of ETH/USD (data feed via Kraken).
- Bitcoin is trading with a bearish angle below the $8,950 and $9,000 resistance levels.
Ethereum price is trading in a broad range versus the US Dollar, while bitcoin is struggling. ETH price might revisit the $182 range support area in the near term.
Ethereum Price Analysis
Yesterday, there was a decent increase in Ethereum above the $188 resistance against the US Dollar. ETH even surpassed the $190 resistance area and the 100 hourly simple moving average.
However, the price struggled to gain strength above $190 and formed a high near the $192 level. Later, there was a downward move below the $188 support area and the 100 hourly simple moving average.
Moreover, the price traded below the 50% Fib retracement level of the upward move from the $180 swing low to $192 high. The bulls even failed to defend the $185 support and the price tested the $183 area.
Ethereum is currently correcting higher and trading near the $186 level. Additionally, it is trading near the 23.6% Fib retracement level of the recent decline from the $192 high to $184 swing low.
On the upside, an immediate resistance is near the $187 level. More importantly, there is a connecting bearish trend line forming with resistance near $187 on the hourly chart of ETH/USD, coinciding with the 100 hourly SMA.
If there is an upside break above the trend line and the 100 hourly SMA, the price could test the $188 resistance area. Any further gains may perhaps push the price towards the $192 swing high in the near term.
Conversely, the price could decline further if it fails to clear the $188 resistance. An immediate support is near the $184 level. The main supports are near the $182 and $180 levels, below which the bears are likely to gain strength.
Looking at the chart, Ethereum price seems to be trading in a broad range between $180 and $190. A successful close on the either side could trigger the next move. As long as there is no daily close below $180, there are chances of a fresh increase towards $200 and $205.
ETH Technical Indicators
Hourly MACD – The MACD for ETH/USD is about to move into the bullish zone.
Hourly RSI – The RSI for ETH/USD is currently rising and it is likely to clear the 50 level.
Major Support Level – $182
Major Resistance Level – $188


