
Reason to trust
How Our News is Made
Strict editorial policy that focuses on accuracy, relevance, and impartiality
Ad discliamer
Morbi pretium leo et nisl aliquam mollis. Quisque arcu lorem, ultricies quis pellentesque nec, ullamcorper eu odio.
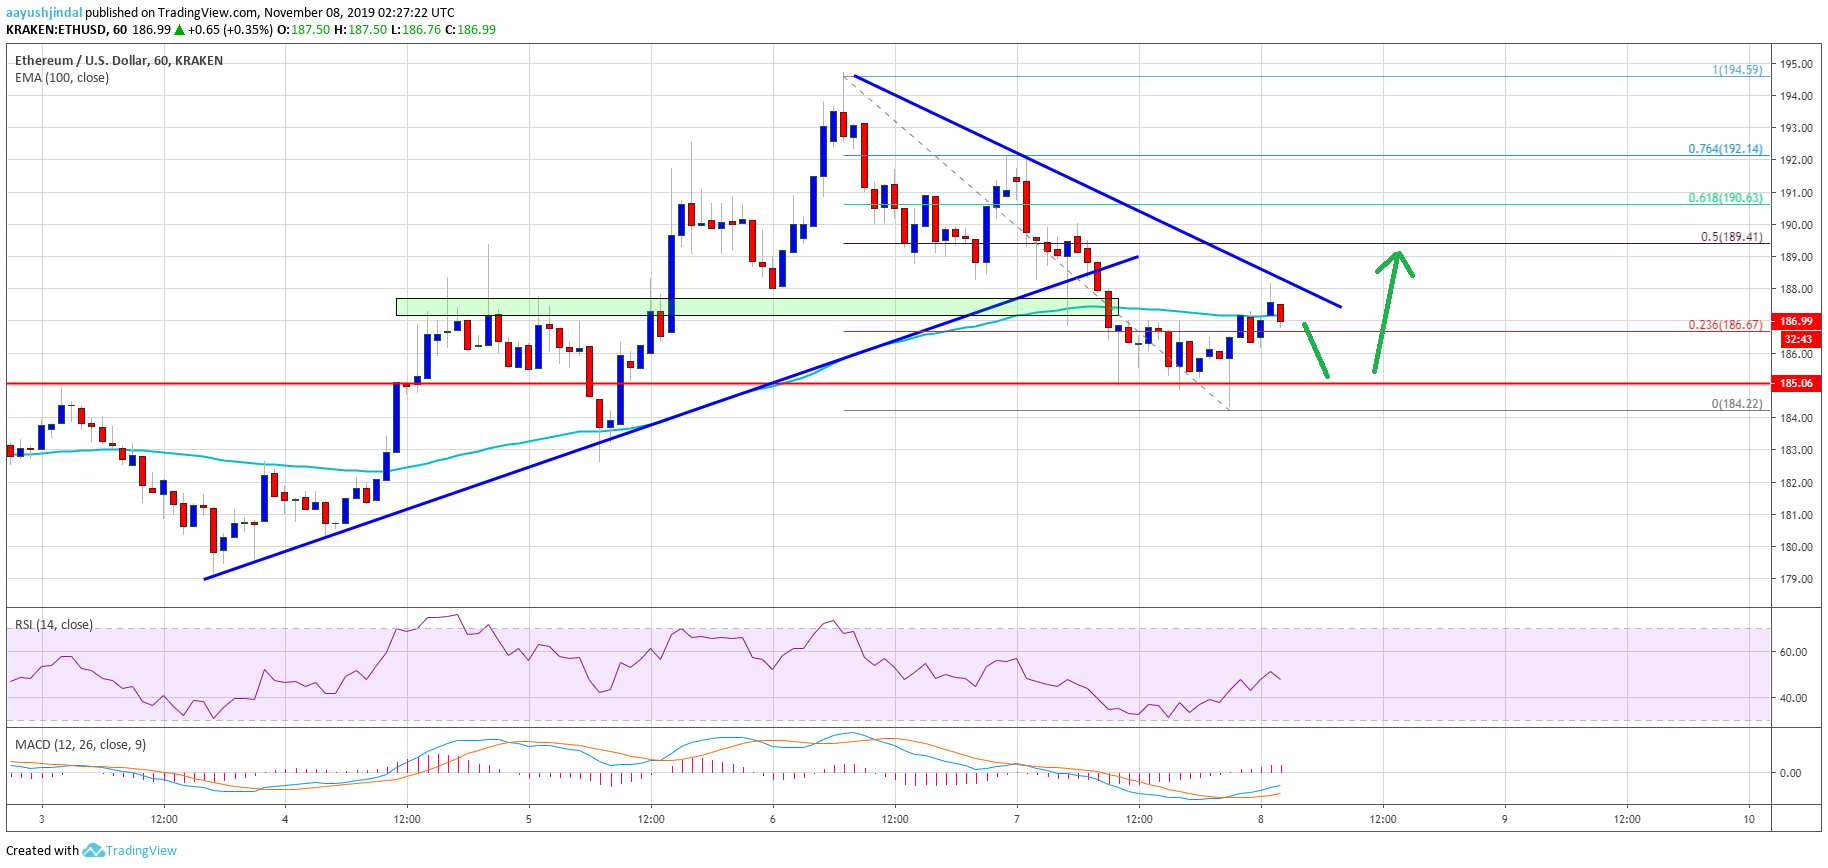
- Ethereum price is currently declining and it is trading below the $188 level against the US Dollar.
- It is holding the $185 support area, but there is a risk of more downsides in the near term.
- This week’s major bullish trend line was breached with support near $189 on the hourly chart of ETH/USD (data feed via Kraken).
- Bitcoin is struggling to hold the $9,200 support and it might continue to decline.
Ethereum price is facing an increase in selling pressure versus the US Dollar, similar to bitcoin. ETH price remains at a risk of a break below $185 and $184.
Ethereum Price Analysis
After a decent upward move above $190, Ethereum struggled to continue higher against the US Dollar. As a result, ETH started a downward move and broke the $190 support area.
Furthermore, there was a break below the $188 support area and the 100 hourly simple moving average. More importantly, this week’s major bullish trend line was breached with support near $189 on the hourly chart of ETH/USD.
The price is now trading near the $185 support area, with a few bearish signs. Additionally, it is trading above the 23.6% Fib retracement level of the recent decline from the $195 high to $185 swing low.
An immediate resistance is near the $188 level. Moreover, there is a connecting bearish trend line forming with resistance near $188 on the same chart. If there is an upside break above the trend line, Ethereum could test the $190 resistance area.
Besides, the 50% Fib retracement level of the recent decline from the $195 high to $185 swing low is also near the $190 level. Therefore, a successful break above the $188 and $190 resistance levels is must for a fresh increase in the near term.
On the downside, an immediate support is near the $185 level. If there is a bearish break and close below the $185 support area, the price may perhaps accelerate its decline below $184 and $182. The next key support is near the $180 level. Any further losses could lead the price towards the $175 level.
Looking at the chart, Ethereum price is struggling to hold the main $185 support area. Thus, there is a risk of more downsides below $185 and $184 in the coming sessions. Conversely, the price needs to climb back above $188 and $190 to move back into a bullish zone.
ETH Technical Indicators
Hourly MACD – The MACD for ETH/USD is slowly moving in the bullish zone.
Hourly RSI – The RSI for ETH/USD is currently recovering and it is now close to the 50 level.
Major Support Level – $185
Major Resistance Level – $190