
Reason to trust
How Our News is Made
Strict editorial policy that focuses on accuracy, relevance, and impartiality
Ad discliamer
Morbi pretium leo et nisl aliquam mollis. Quisque arcu lorem, ultricies quis pellentesque nec, ullamcorper eu odio.
- Ripple price is holding a couple of important supports near $0.2980 and $0.2960 against the US dollar.
- The price is facing a couple of hurdles near the $0.3020 and $0.3040 levels.
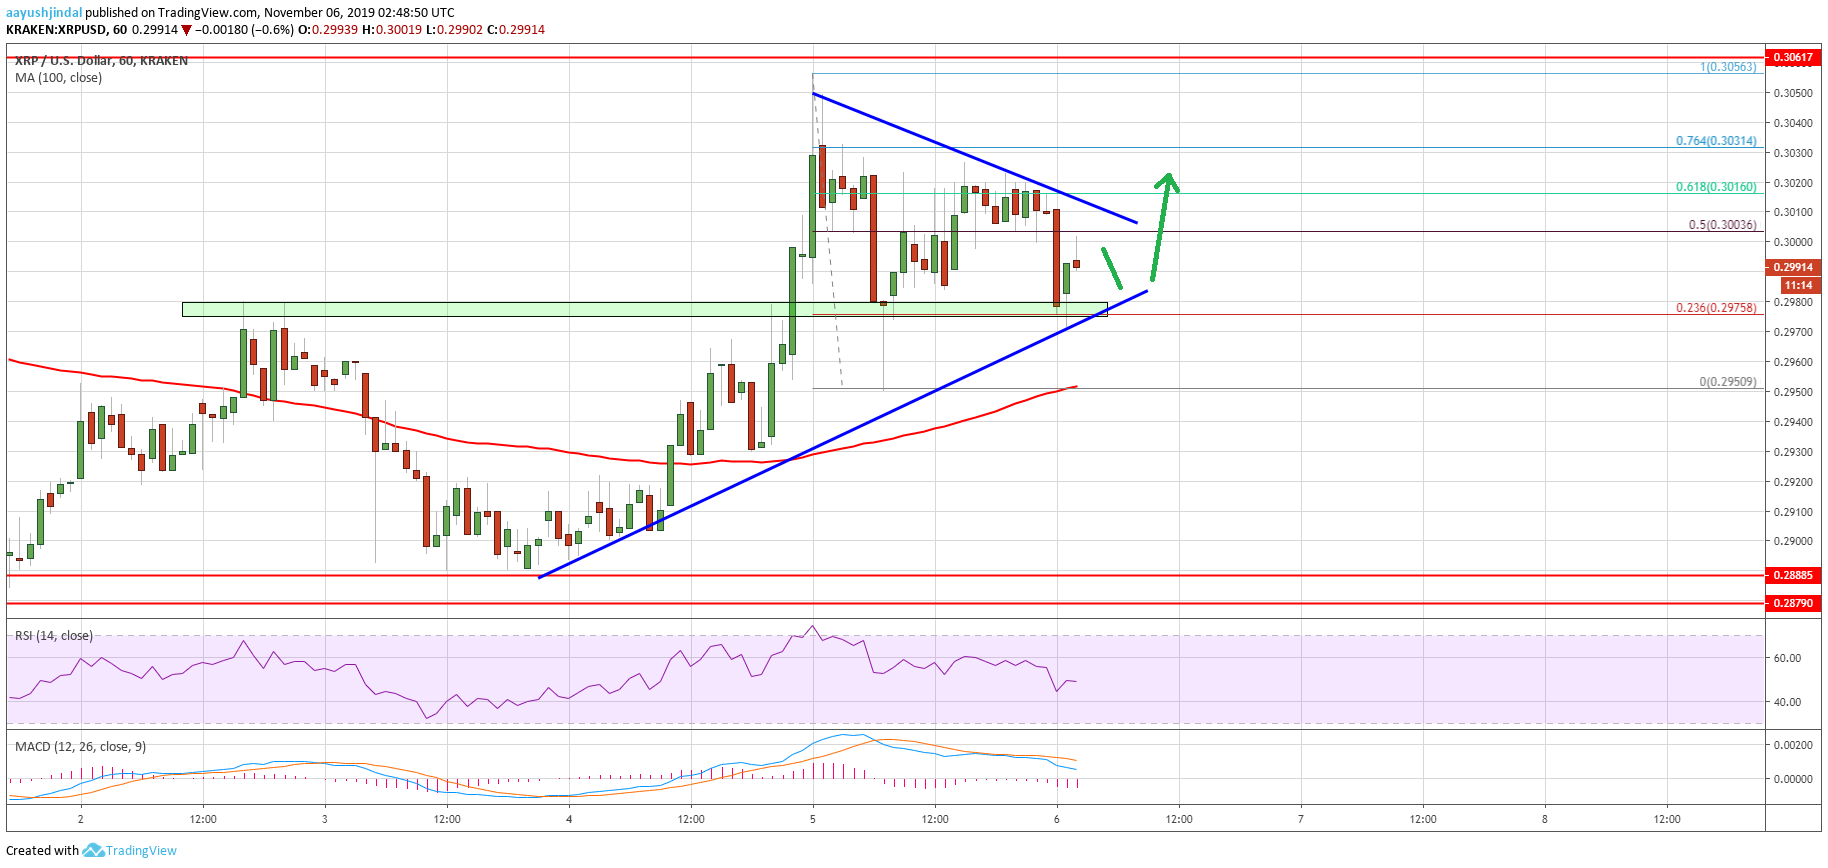
- There is a key breakout pattern forming with resistance near $0.3010 on the hourly chart of the XRP/USD pair (data source from Kraken).
- There could be a nice upward move once the price clears the $0.3020 and $0.3050 resistances.
Ripple price is trading in an uptrend above key supports against the US Dollar and bitcoin. XRP price is likely to continue higher towards $0.3060 and $0.3100 in the near term.
Ripple Price Analysis
Yesterday, we saw a nice upward move above the $0.3000 resistance in ripple against the US Dollar. Moreover, XRP price traded above the $0.3020 level and formed a new weekly high near $0.3056.
Later, there was a downside correction below the $0.3020 and $0.3000 support levels. The price even spiked below the $0.2980 support, but the $0.2950 area acted as a strong support. More importantly, the price climbed above $0.2980 and settled above the 100 hourly simple moving average.
There was a break above the 50% Fib retracement level of the downside correction from the $0.3056 high to $0.2950 low. However, ripple price seems to be facing a couple of key resistances near the $0.3020 level.
Additionally, there is a key breakout pattern forming with resistance near $0.3010 on the hourly chart of the XRP/USD pair. The triangle resistance is near the 61.8% Fib retracement level of the downside correction from the $0.3056 high to $0.2950 low.
Therefore, an upside break above the $0.3020 area is needed for more upsides. The next key resistance area is near the $0.3050 level. A successful close above $0.3050 is likely to push the price towards the $0.3100 and $0.3120 levels.
Conversely, the $0.2980 area is a strong buy zone and a breakdown area. If there is a downside break below the $0.2980 support, the price could slide again towards the $0.2950 support and the 100 hourly SMA. Any further losses may perhaps push the price towards the $0.2920 level.
Looking at the chart, ripple price is clearly holding a major support near the $0.2980 level. Thus, there are chances of an upside break above the $0.3010 and $0.3020 levels. If not, the price might start another decline towards the $0.2950 and $0.2920 levels.
Technical Indicators
Hourly MACD – The MACD for XRP/USD is currently gaining pace in the bearish zone.
Hourly RSI (Relative Strength Index) – The RSI for XRP/USD is struggling to stay above the 50 level.
Major Support Levels – $0.2980, $0.2950 and $0.2940.
Major Resistance Levels – $0.3010, $0.3020 and $0.3050.


