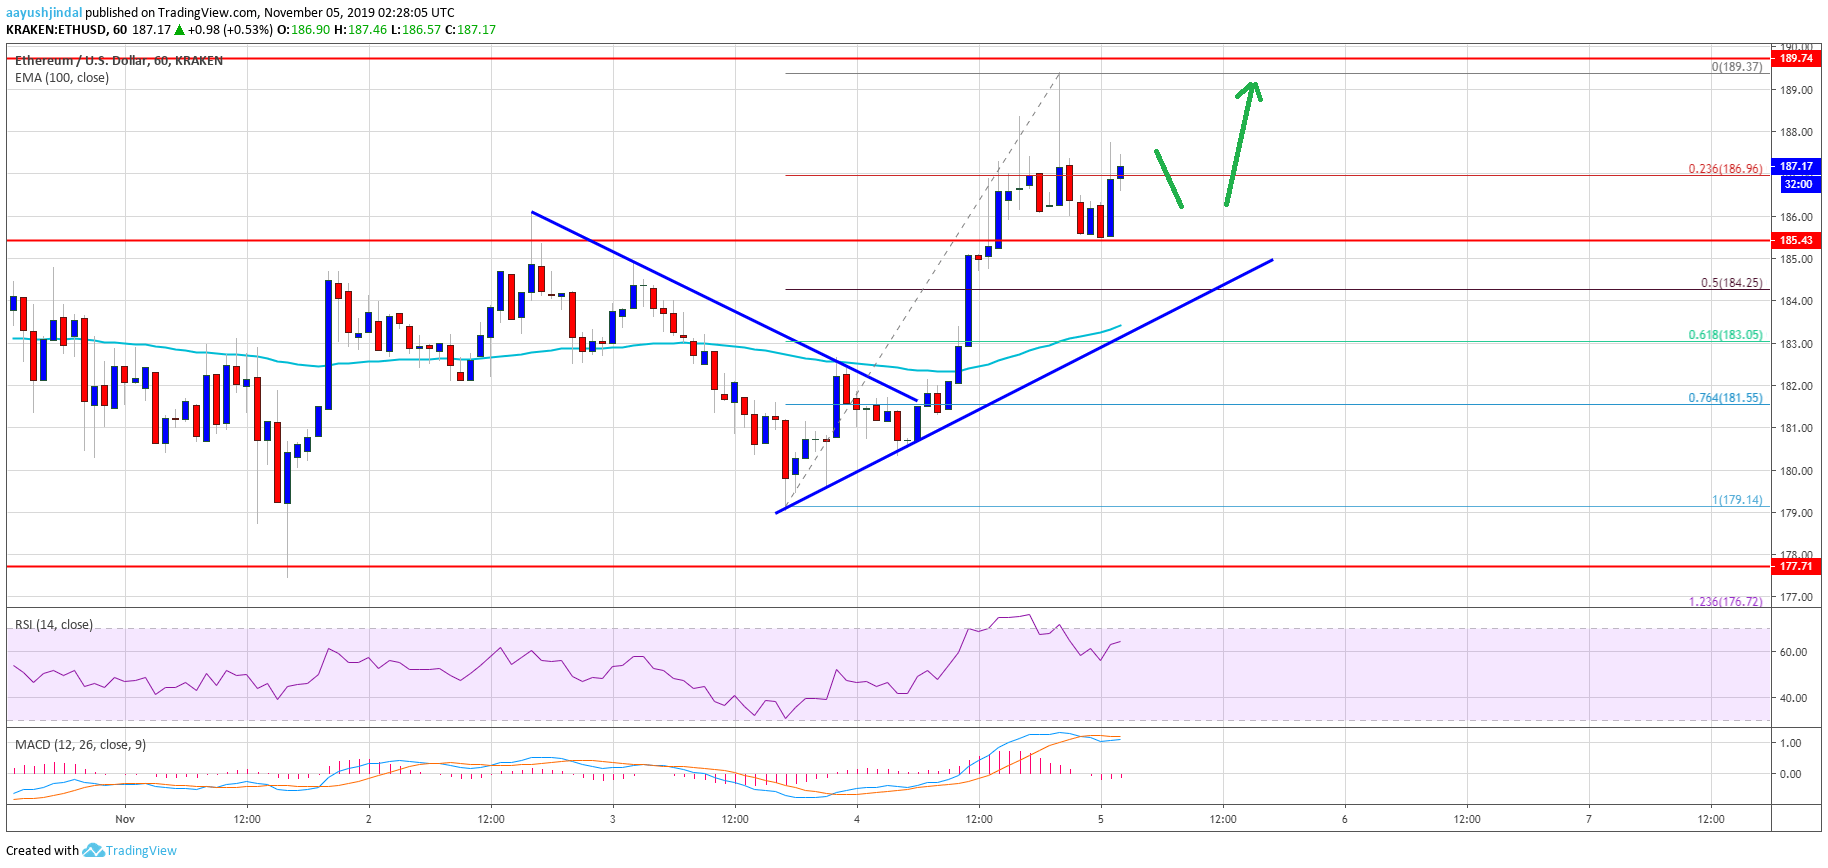
- Ethereum price is rising and it broke the key $185 and $186 resistance levels against the US Dollar.
- Bitcoin is up around 3% and it managed to climb above the $9,400 resistance.
- There is a new bullish trend line forming with support near $185 on the hourly chart of ETH/USD (data feed via Kraken).
- The pair remains supported on dips and it could continue to rise towards the $200 level in the near term.
Ethereum price is slowly climbing higher versus the US Dollar, similar to bitcoin. ETH price is likely to rise towards the $200 level as long as above $182.
Ethereum Price Analysis
After forming a support base near $180, Ethereum started a steady rise above $182 against the US Dollar. ETH price recovered and broke a strong resistance near the $185 and $186 levels.
Moreover, there was a close above the $185 level and the 100 hourly simple moving average. During the rise, there was a break above yesterday’s highlighted bearish trend line with resistance near $182.
Finally, the price tested the $190 resistance area and it is currently correcting lower. There was a break below the $188 level, plus the 23.6% Fib retracement level of the recent wave from the $179 swing low to $189 swing high.
However, the previous resistance near the $185 area is now acting as a decent support. More importantly, there is a new bullish trend line forming with support near $185 on the hourly chart of ETH/USD.
The 50% Fib retracement level of the recent wave from the $179 swing low to $189 swing high is also near the trend line to provide support. The main support is near the $182 level since it coincides with the 100 hourly SMA.
If Ethereum breaks the trend line and trades below $182, it could move back into a bearish zone. On the upside, an immediate resistance is near the $190 level. If there is a proper break above $190, the price could start an increase towards the main $200 resistance area.
Looking at the chart, Ethereum price is showing a few positive signs above the $185 support area. Having said that, the path towards the $200 barrier won’t be easy. If the bulls struggle to clear the $190 and $192 resistance levels, there could be a bearish reaction below the $185 support. In the mentioned case, the $182 support holds the key.
ETH Technical Indicators
Hourly MACD – The MACD for ETH/USD is about to move back into the bullish zone.
Hourly RSI – The RSI for ETH/USD is currently well above the 50 level, with positive signs.
Major Support Level – $182
Major Resistance Level – $190


