Reason to trust
How Our News is Made
Strict editorial policy that focuses on accuracy, relevance, and impartiality
Ad discliamer
Morbi pretium leo et nisl aliquam mollis. Quisque arcu lorem, ultricies quis pellentesque nec, ullamcorper eu odio.
- Ethereum price is facing a lot of hurdles on the upside near $185 and $186 against the US Dollar.
- Bitcoin is somehow holding the key $9,000 and $8,960 support levels.
- There is a key bearish trend line forming with resistance near $182 on the hourly chart of ETH/USD (data feed via Kraken).
- The pair is mostly trading in a range above the $178 support and below the $186 resistance.
Ethereum price is facing an uphill task versus the US Dollar, similar to bitcoin. ETH price could continue to trade in a range before the next move either above $186 or below $178.
Ethereum Price Analysis
In the past few sessions, Ethereum was seen trading in a range above the $178 support against the US Dollar. ETH price made a couple of attempts to start a fresh increase, but it faced a strong resistance near the $185 and $186 levels.
The last swing high was near $186 before the price declined below the $182 and $180 levels. Moreover, there was a close below the $182 support and the 100 hourly simple moving average. A low was formed near $179 and the price is currently correcting higher.
It surpassed the 23.6% Fib retracement level of the recent decline from the $186 high to $179 low. However, the $182 level and the 100 hourly SMA are acting as a strong hurdle for the bulls.
Additionally, the 50% Fib retracement level of the recent decline from the $186 high to $179 low is acting as a resistance. More importantly, there is a key bearish trend line forming with resistance near $182 on the hourly chart of ETH/USD.
Therefore, an upside break above the $182 resistance might push Ethereum price higher. On the upside, the main resistances are near $185 and $186. A clear break above $186 is needed for upside acceleration in the near term.
On the downside, an immediate support is near the $180 level. If there are more downsides, the price could revisit the range support area near the $178 level. A clear break below the $178 support could spark more losses towards $175 and $170.
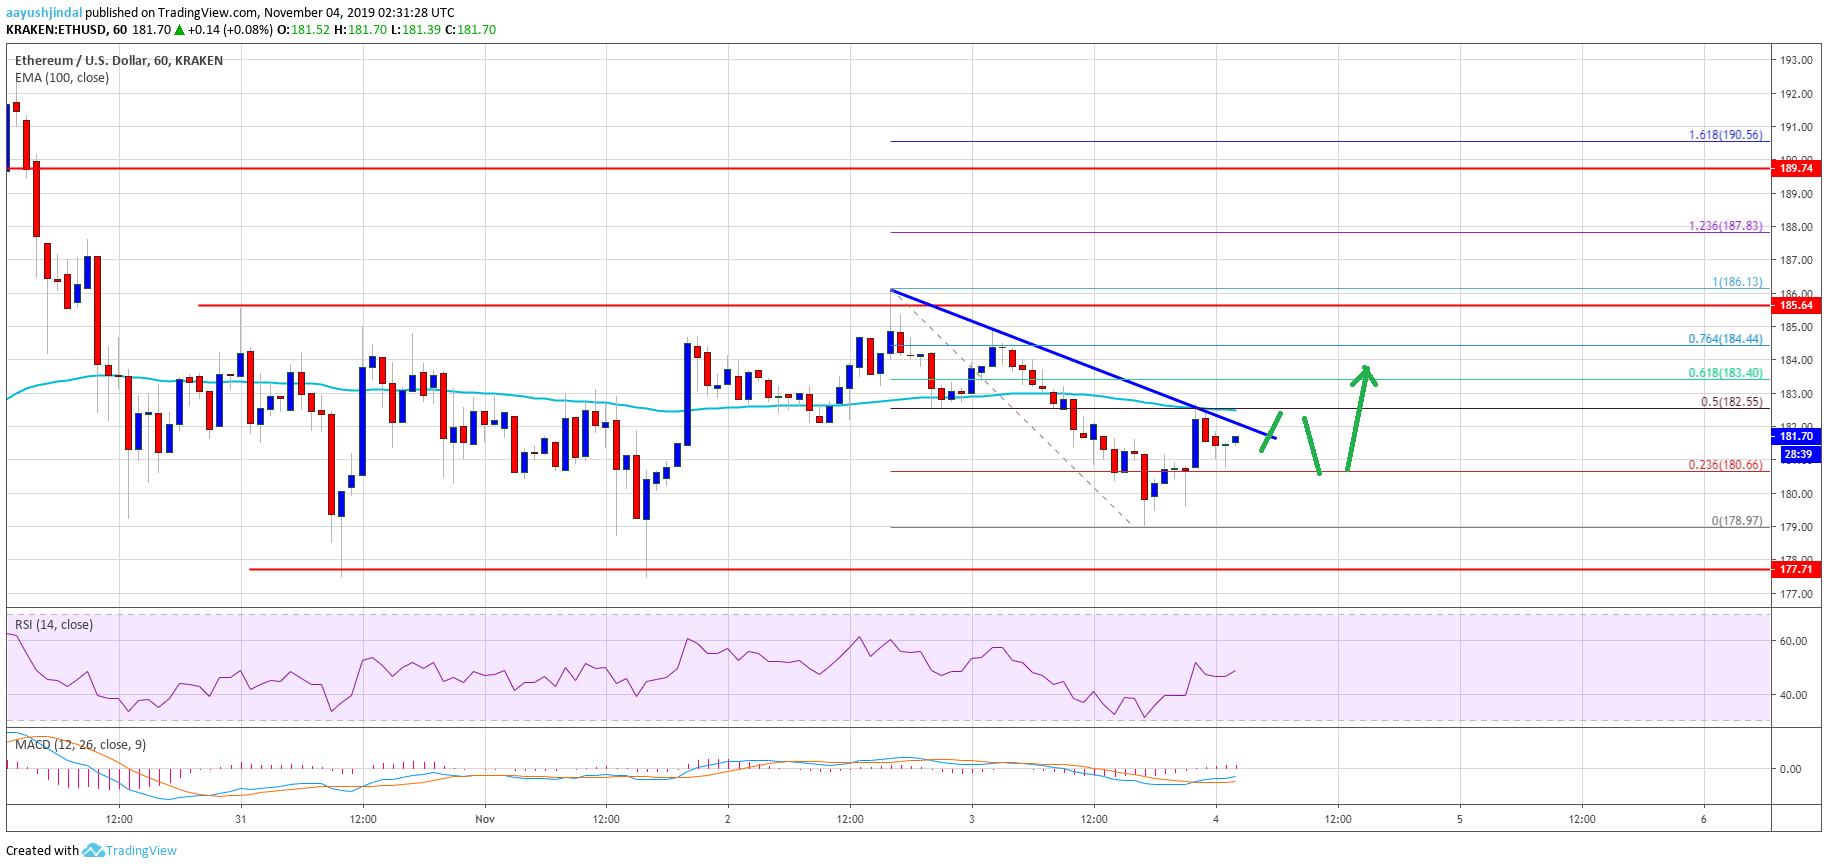
Looking at the chart, Ethereum price is trading in a range above the $178 support and below the $186 resistance. It may perhaps continue to trade in a range before the next move, which could be either towards the $200 barrier or the $165 support area.
ETH Technical Indicators
Hourly MACD – The MACD for ETH/USD is slowly moving into the bullish zone.
Hourly RSI – The RSI for ETH/USD is currently recovering, but it is still below the 50 level.
Major Support Level – $178
Major Resistance Level – $185