
Reason to trust
How Our News is Made
Strict editorial policy that focuses on accuracy, relevance, and impartiality
Ad discliamer
Morbi pretium leo et nisl aliquam mollis. Quisque arcu lorem, ultricies quis pellentesque nec, ullamcorper eu odio.
- Bitcoin price is declining and struggling to stay above the $9,000 support against the US Dollar.
- The price is could correct higher, but it might face resistance near the $9,200 and $9,300 levels.
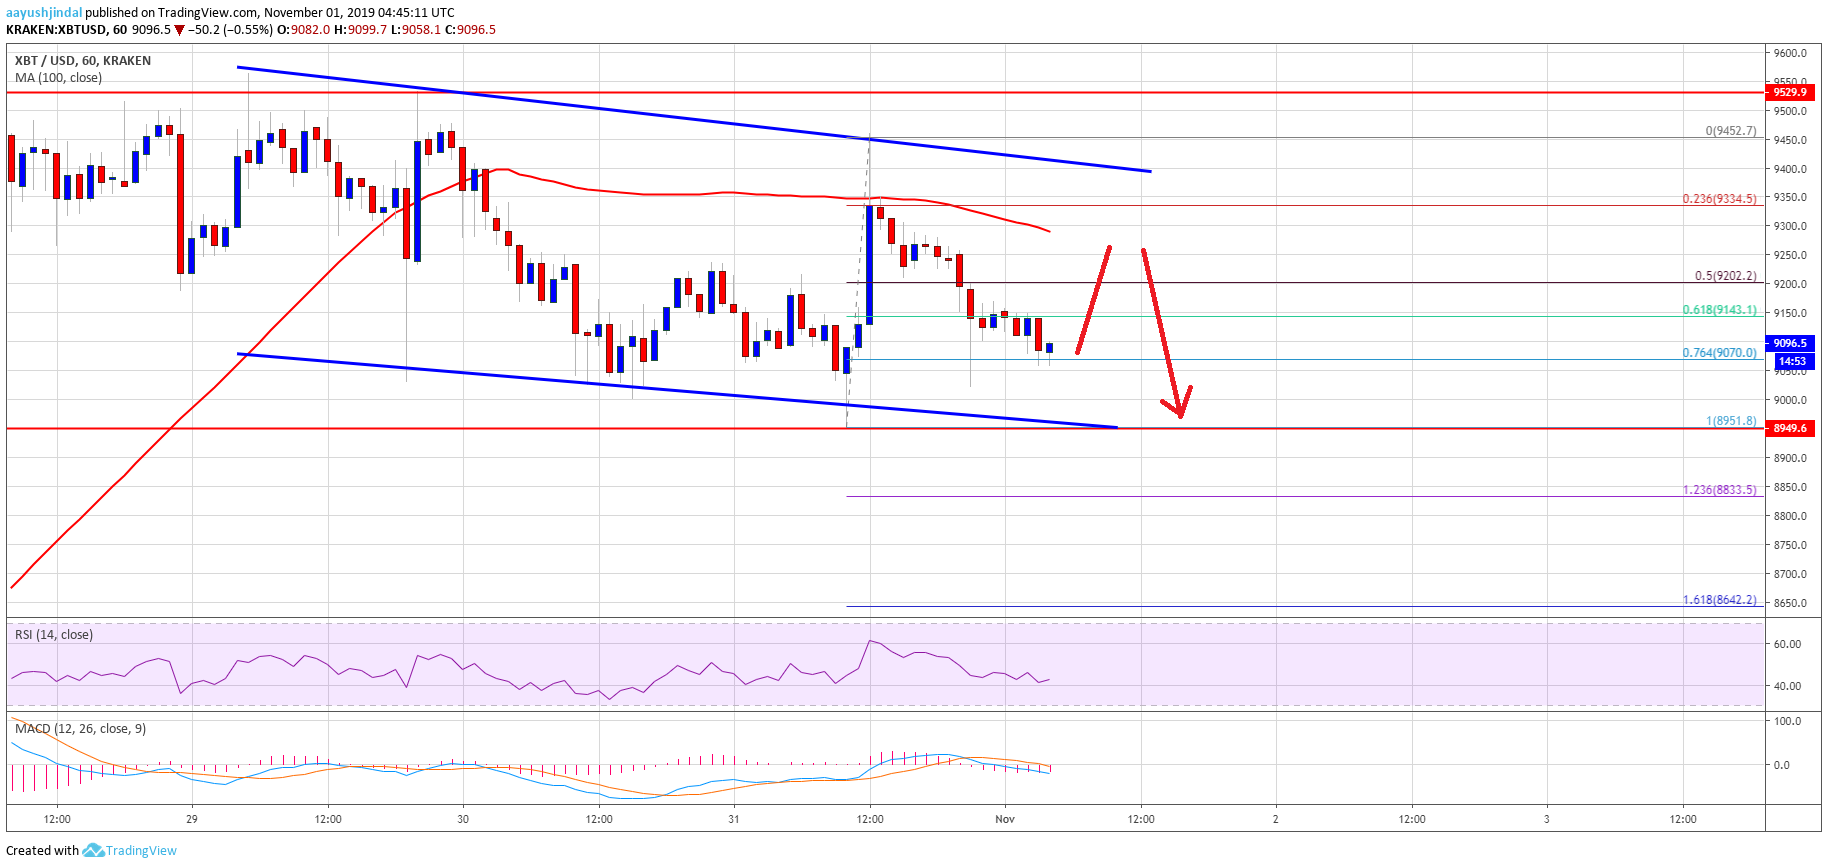
- There is a declining channel forming with resistance near $9,400 on the hourly chart of the BTC/USD pair (data feed from Kraken).
- Both Ethereum and ripple are showing a few bearish signs below $185 and $0.2950 respectively.
Bitcoin price is struggling to start a fresh increase above $9,400 against the US Dollar. Therefore, there is a risk of another drop below the $9,000 support in the near term.
Bitcoin Price Analysis
After struggling near the $9,500 resistance, bitcoin started a steady decline against the US Dollar. BTC traded below a couple of key supports near the $9,400 and $9,320 levels.
Moreover, there was a break below the $9,200 support and the 100 hourly simple moving average. The price even spiked below the $9,000 support area and traded to a new weekly low near the $8,951 level.
Recently, there was an upside correction above the $9,250 level. Besides, the price climbed above the $9,300 resistance, but it failed to gain momentum above $9,400. A high was formed near $9,452 and the price is currently declining.
There was a break below the $9,200 support, plus the 50% Fib retracement level of the upward move from the $8,951 low to $9,452 high. At the outset, bitcoin price is testing the $9,080 support area.
It seems like the 76.4% Fib retracement level of the upward move from the $8,951 low to $9,452 high is acting as a decent support. However, the main support is near the $9,000 level, below which there is a risk of an extended decline towards the $8,950 and $8,830 levels.
On the upside, there are many hurdles near the $9,200 and $9,300 levels. More importantly, the 100 hourly simple moving average is also near the $9,300 level to act as a hurdle.
Finally, there is a declining channel forming with resistance near $9,400 on the hourly chart of the BTC/USD pair. Therefore, the price must climb above $9,300 and $9,400 to start a strong rise in the near term.
Looking at the chart, bitcoin is showing a few bearish signs below $9,200 and $9,300. It seems like there could be another bearish reaction below the $9,000 support. On the upside, the $9,300 level now holds the key for a fresh upward move.
Technical indicators:
Hourly MACD – The MACD is slowly moving into the bullish zone.
Hourly RSI (Relative Strength Index) – The RSI for BTC/USD is currently moving higher and it could climb to 50.
Major Support Levels – $9,000 followed by $8,830.
Major Resistance Levels – $9,200, $9,300 and $9,400.