Reason to trust
How Our News is Made
Strict editorial policy that focuses on accuracy, relevance, and impartiality
Ad discliamer
Morbi pretium leo et nisl aliquam mollis. Quisque arcu lorem, ultricies quis pellentesque nec, ullamcorper eu odio.
- Ripple price is rising slowly and it is still below the $0.3150 resistance area against the US dollar.
- The price is facing a lot of hurdles on the upside near the $0.3120 and $0.3150 levels.
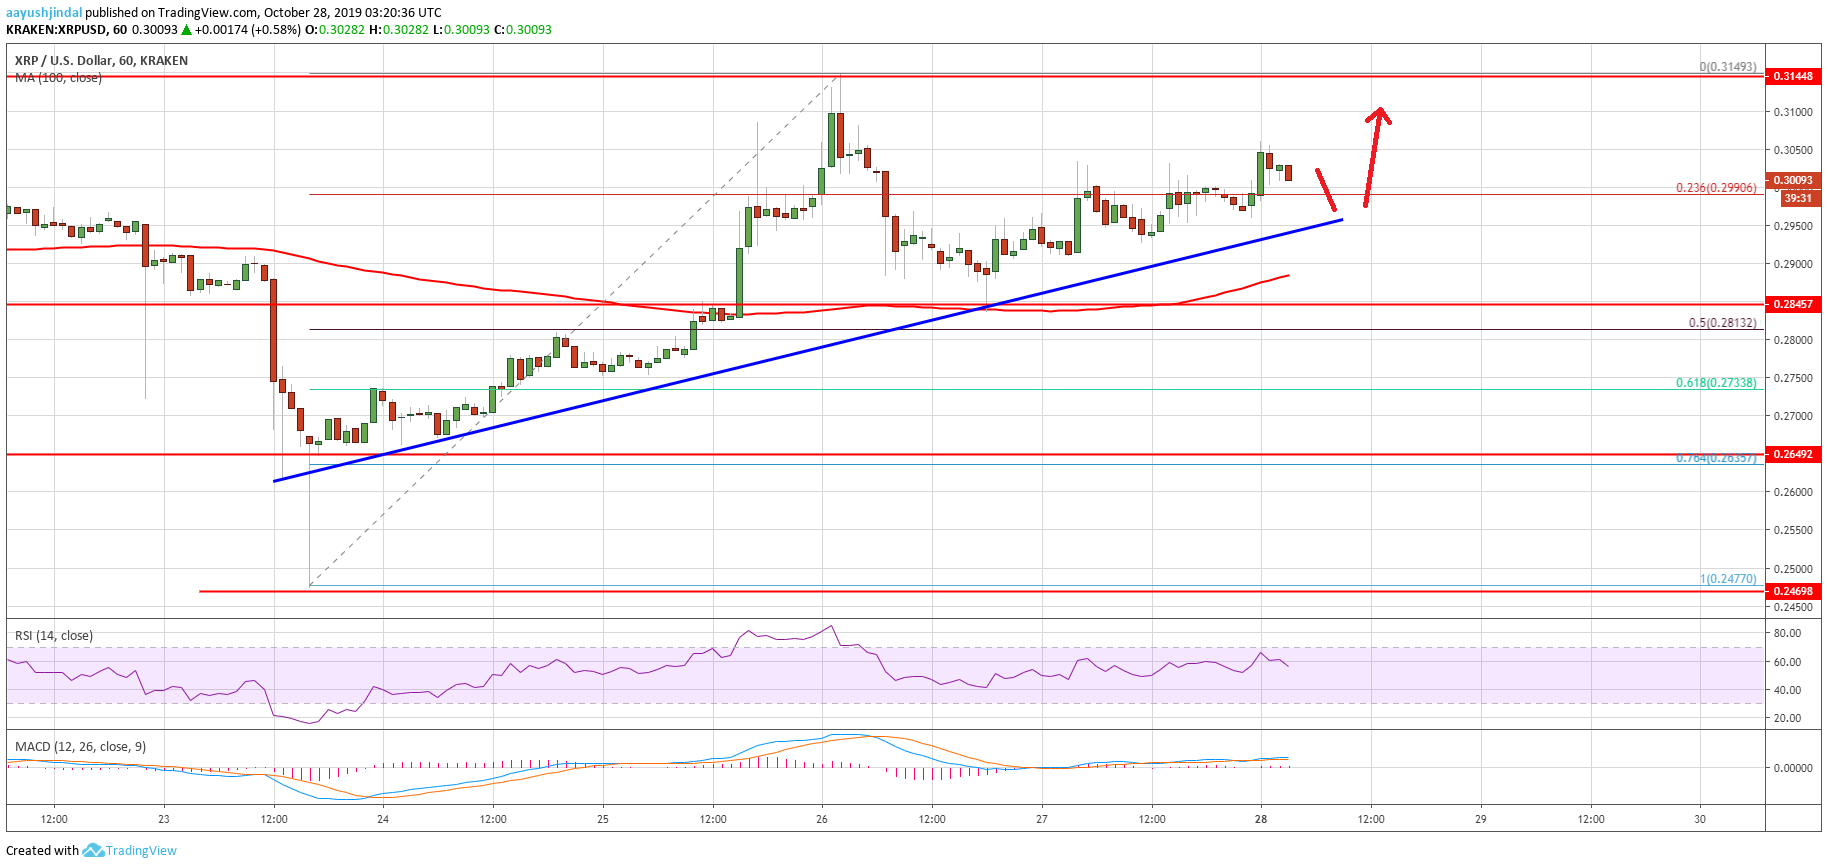
- There is a key bullish trend line forming with support near $0.2950 on the hourly chart of the XRP/USD pair (data source from Kraken).
- Many altcoins, including TRX, ONT, NEO, and VET are up more than 20% in the past three sessions.
Ripple price is rising with a slower pace against the US Dollar, while bitcoin and Ethereum are grinding higher. XRP price must break $0.3150 to continue higher.
Ripple Price Analysis
In the past few days, we saw a sharp rally in bitcoin, Ethereum and a few major altcoins against the US Dollar. Ripple price also climbed higher and broke the $0.2850 and $0.3000 resistance levels.
Moreover, the price climbed above $0.3040 and settled above the 100 hourly simple moving average. A swing high was formed near $0.3149 before the price started a downside correction.
There was a break below the $0.3000 support area. Moreover, the price traded below the 23.6% Fib retracement level of the upward move from the $0.2470 low to $0.3179 high. Finally, there was a break below the $0.2950 support area.
However, the $0.2850 support area acted as a strong support along with the 100 hourly SMA. Besides, the price remained stable above the 50% Fib retracement level of the upward move from the $0.2470 low to $0.3179 high.
At the outset, ripple price is rising steadily and trading above the $0.3000 level. More importantly, there is a key bullish trend line forming with support near $0.2950 on the hourly chart of the XRP/USD pair.
If there is a downside break below the trend line, the price could revisit the $0.2850 support area and the 100 hourly SMA. Any further losses may perhaps increase bearish pressure and push the price back towards the $0.2750 support area.
On the upside, there are many hurdles near the $0.3040 and $0.3050 levels. If the price climbs higher steadily, it could revisit the $0.3150 resistance. A clear break above $0.3150 could push the price towards $0.3220.
Looking at the chart, ripple price is rising steadily, but with a slow pace above $0.3000. Therefore, there could be another minor dip towards $0.2900 or $0.2850 before the price starts a strong rise in the coming sessions.
Technical Indicators
Hourly MACD – The MACD for XRP/USD is likely to move back into the bearish zone.
Hourly RSI (Relative Strength Index) – The RSI for XRP/USD is correcting lower and it could test the 50 level.
Major Support Levels – $0.2950, $0.2900 and $0.2850.
Major Resistance Levels – $0.3050, $0.3120 and $0.3150.