
Reason to trust
How Our News is Made
Strict editorial policy that focuses on accuracy, relevance, and impartiality
Ad discliamer
Morbi pretium leo et nisl aliquam mollis. Quisque arcu lorem, ultricies quis pellentesque nec, ullamcorper eu odio.
- Ethereum price is showing positive signs above the $175 and $180 levels against the US Dollar.
- Bitcoin price is climbing higher and it is likely to revisit the key $10,000 resistance area.
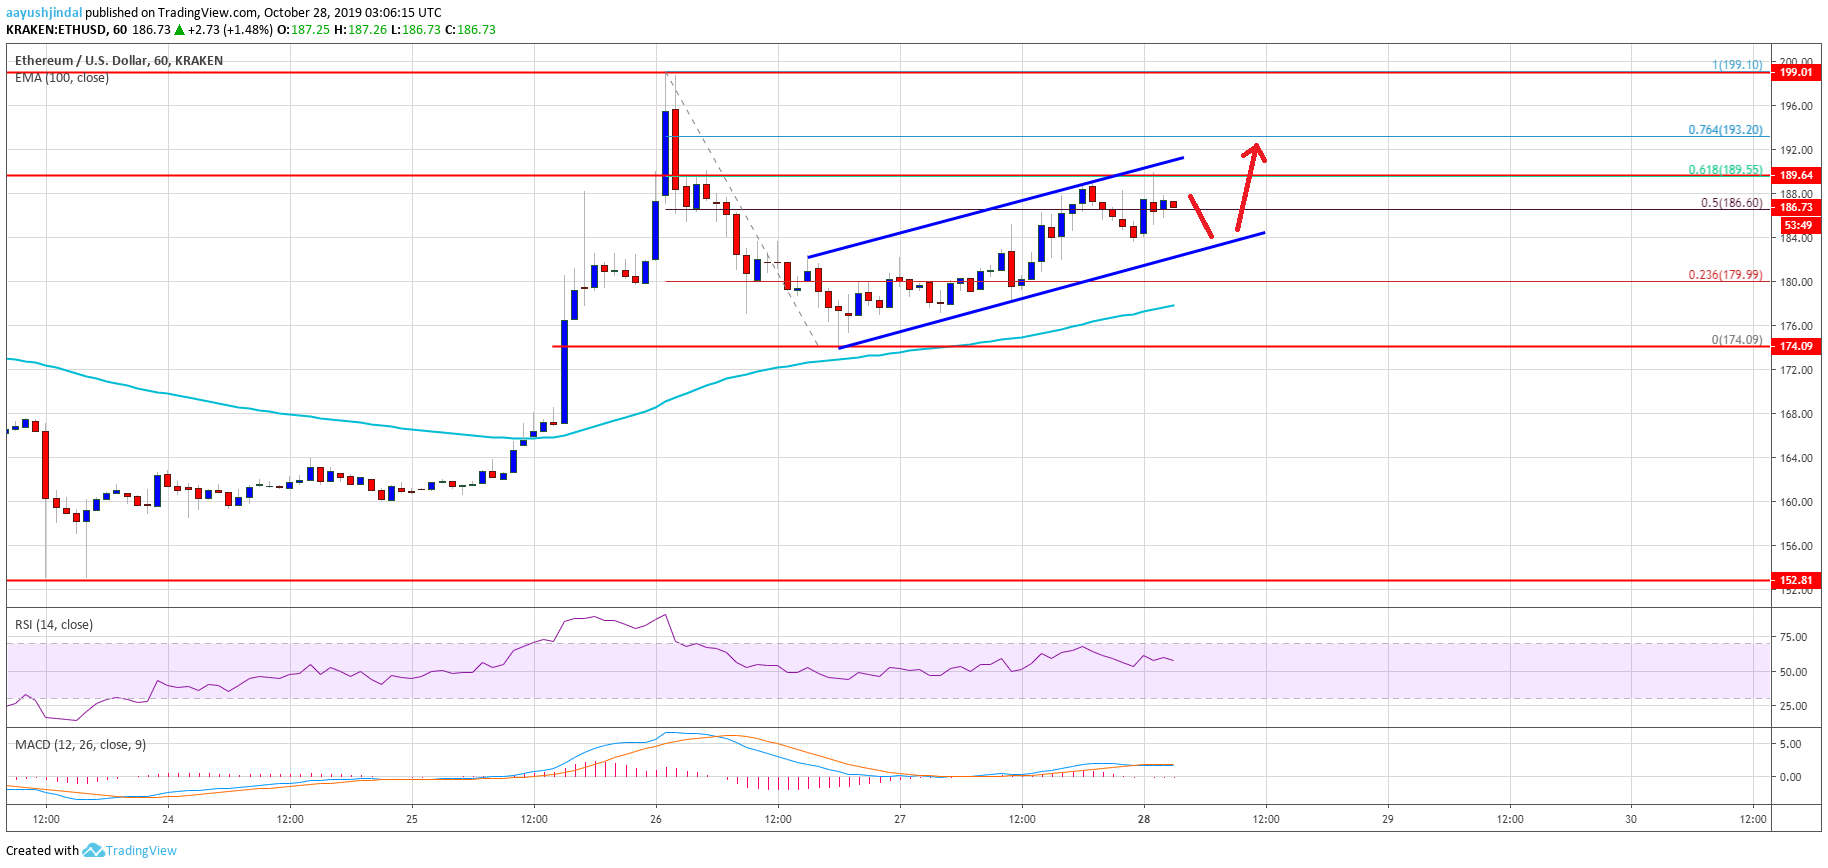
- There is a rising channel forming with support near $183 on the hourly chart of ETH/USD (data feed via Kraken).
- The pair is likely to continue higher and it break the $190 and $192 resistance levels in the near term.
Ethereum price is grinding higher with positive signs versus the US Dollar, while bitcoin is approaching $10,000. ETH price must break $190 to climb towards $200.
Ethereum Price Analysis
In the past few days, there was a sharp rally in Ethereum above the $175 and $180 resistance levels. Later, there was a downside correction, but the price remained well bid above $175 and the 100 hourly simple moving average.
Similarly, bitcoin price rallied above the $10,000 level and recently corrected lower. However, BTC also found support and it is climbing higher again towards the main $10,000 resistance area.
The recent swing low was near $175 before Ethereum started a fresh increase. It broke the $180 and $182 resistance levels. Moreover, there was a break above the 50% Fib retracement level of the downward move from the $199 high to $175 swing low.
The price tested the $190 resistance level, where the bears are putting up a strong fight. Additionally, it seems like the 61.8% Fib retracement level of the downward move from the $199 high to $175 swing low is acting as a resistance.
Therefore, an upside break above the $190 resistance is likely to open the doors for more gains in the coming sessions. The next major resistance is near the $198 and $200 levels. An intermediate resistance is $194 or the 76.4% Fib retracement level of the downward move from the $199 high to $175 swing low.
On the downside, there are many supports near the $180 level. Besides, there is a rising channel forming with support near $183 on the hourly chart of ETH/USD. If there is a downside break, the price could test the 100 hourly SMA or the $175 support.
Looking at the chart, Ethereum price is clearly climbing higher steadily above $185. Having said that, the price must break the $190 resistance level to continue higher. If not, there are chances of another downside correction towards the $175 support area in the near term.
ETH Technical Indicators
Hourly MACD – The MACD for ETH/USD is slowly losing momentum in the bullish zone.
Hourly RSI – The RSI for ETH/USD is correcting lower and it is approaching the 50 level.
Major Support Level – $180
Major Resistance Level – $190