Reason to trust
How Our News is Made
Strict editorial policy that focuses on accuracy, relevance, and impartiality
Ad discliamer
Morbi pretium leo et nisl aliquam mollis. Quisque arcu lorem, ultricies quis pellentesque nec, ullamcorper eu odio.
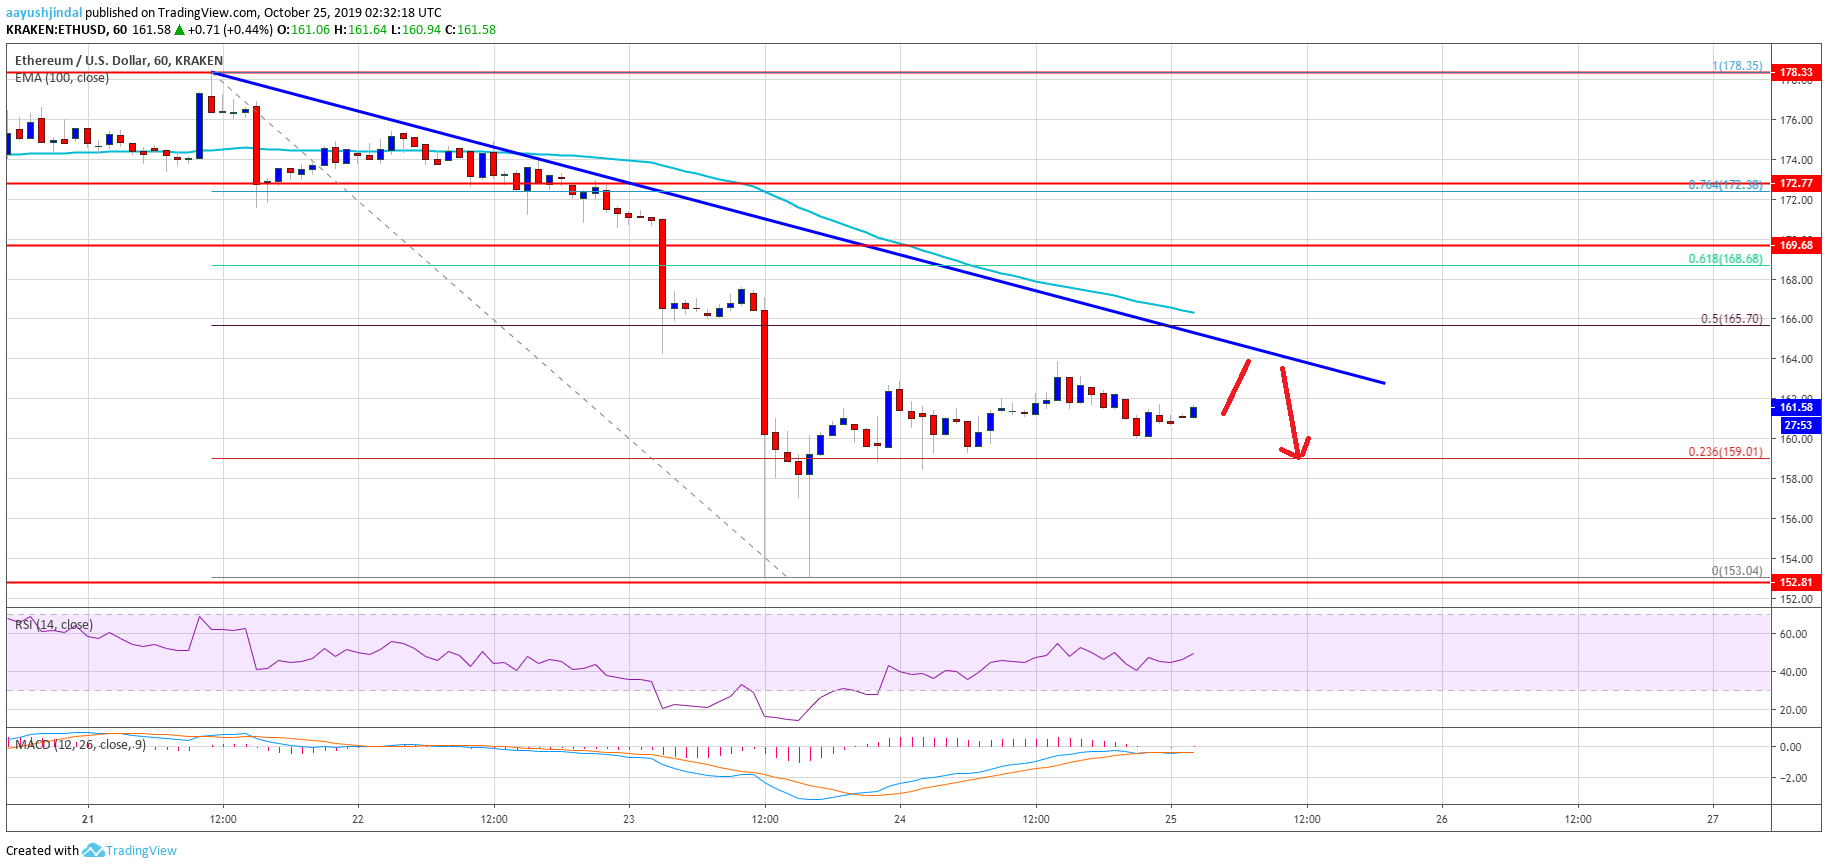
- Ethereum price is currently correcting losses after it traded as low as $$153 against the US Dollar.
- Bitcoin price is struggling to recover above the $7,500 and $7,600 resistance levels.
- This week’s followed bearish trend line is still active with resistance near $164 on the hourly chart of ETH/USD (data feed via Kraken).
- The pair is likely to face a strong resistance near the $164 and $165 levels in the near term.
Ethereum price is slowly rebounding versus the US Dollar, while bitcoin is still struggling. ETH price must climb above $165 to extend its recovery to $170.
Ethereum Price Analysis
Yesterday, we saw a massive decline in Ethereum below the $170 and $165 support levels against the US Dollar. Moreover, ETH price settled below the $165 support and the 100 hourly simple moving average.
It opened the doors for more losses and the price traded below the $160 support. Finally, there was a spike below $155 and the price traded as low as $153. Recently, it started an upside correction above the $155 and $158 levels.
Additionally, there was a break above the 23.6% Fib retracement level of the downward move from the $178 high to $153 low. Ethereum is currently consolidating above $160, but it is facing a lot of hurdles on the upside near the $164 and $165 levels.
More importantly, this week’s followed bearish trend line is still active with resistance near $164 on the hourly chart of ETH/USD. The trend line coincides with the 50% Fib retracement level of the downward move from the $178 high to $153 low.
Besides, the 100 hourly SMA is also positioned near the $165 level. Therefore, an upside break above the $165 resistance is needed for a recovery towards the $170 and $172 resistance levels.
If the price fails to recover above the $164 and $165 resistance levels, it could resume its decline. An immediate support is near the $158 level, below which the price could revisit the $153 low. Any further losses might call for a break below the $150 support area.
Looking at the chart, Ethereum price is clearly facing a lot of barriers on the upside near $164 and $165. In the short term, the price could make an attempt to surpass $165 and the 100 hourly SMA. However, it is likely to fail near $165 and likely to resume its decline in the coming sessions.
ETH Technical Indicators
Hourly MACD – The MACD for ETH/USD is slowly moving back into the bearish zone.
Hourly RSI – The RSI for ETH/USD is correcting higher and is approaching the key 50 level.
Major Support Level – $153
Major Resistance Level – $165