
Reason to trust
How Our News is Made
Strict editorial policy that focuses on accuracy, relevance, and impartiality
Ad discliamer
Morbi pretium leo et nisl aliquam mollis. Quisque arcu lorem, ultricies quis pellentesque nec, ullamcorper eu odio.
- Ethereum price is declining again after it failed to break $178 and $180 against the US Dollar.
- Bitcoin price is also moving down and it is likely to break the $8,000 support area.
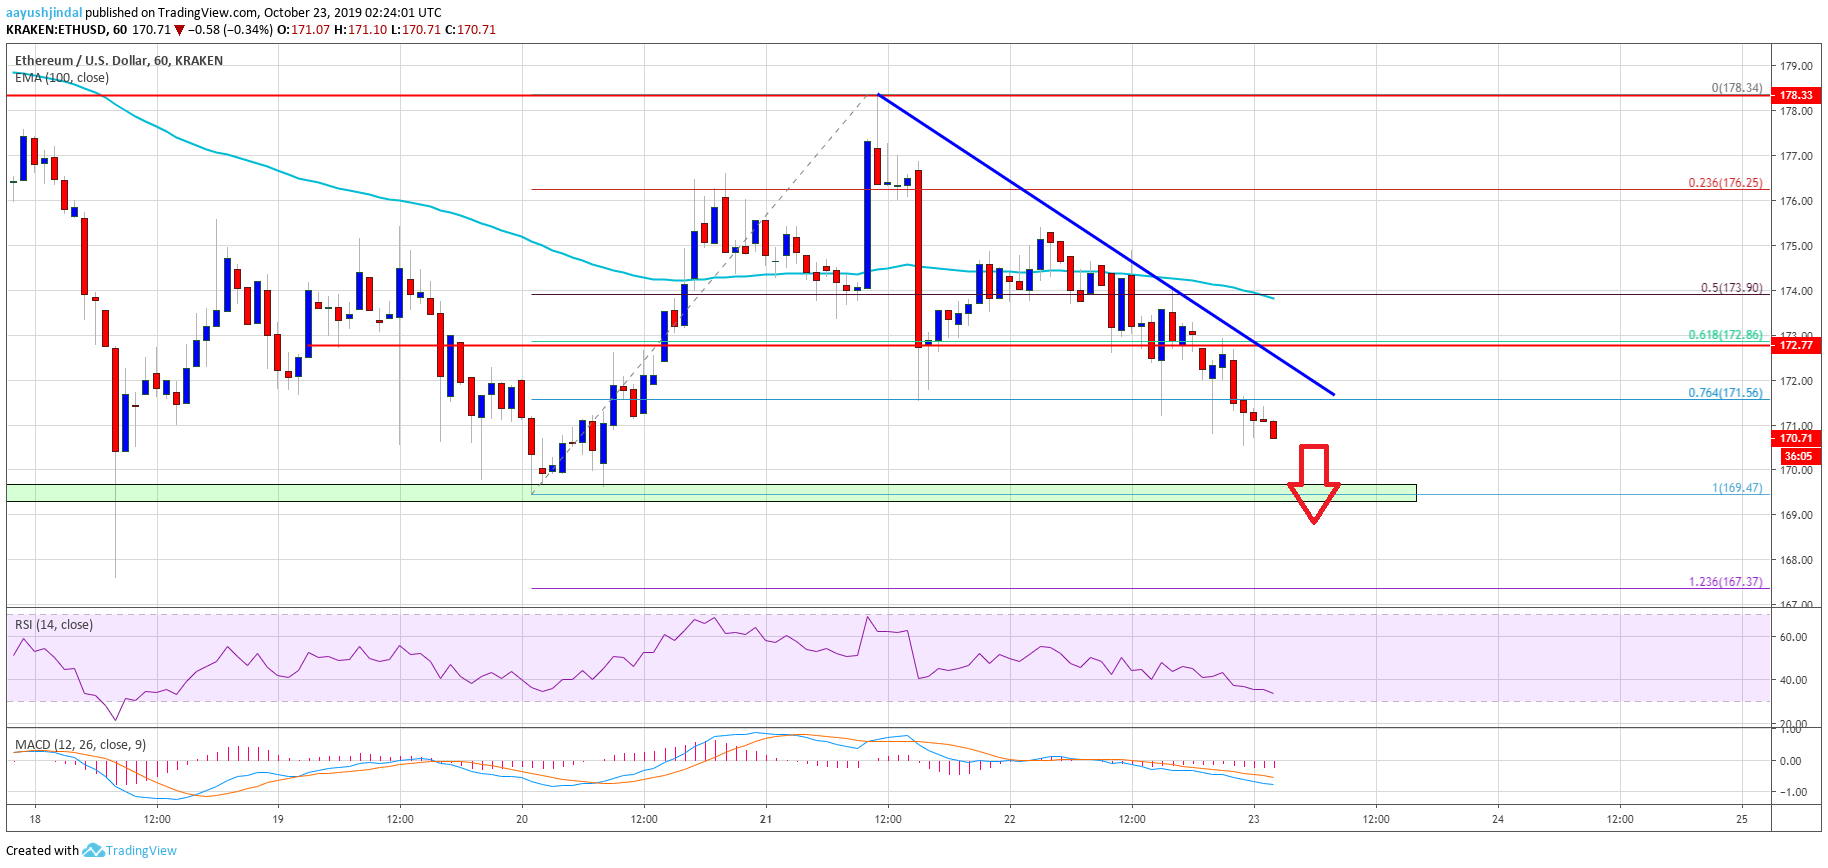
- There is a key bearish trend line forming with resistance near $172 on the hourly chart of ETH/USD (data feed via Kraken).
- The pair remains at a risk of more downsides below the $170 and $168 support levels.
Ethereum price is resuming its downtrend below $175 versus the US Dollar, similar to bitcoin. ETH price could even break the $168 support and decline towards $160.
Ethereum Price Analysis
This week, we discussed the importance of the $178 and $180 resistance levels for Ethereum against the US Dollar. ETH did test the $178 resistance area recently, but it failed to continue higher.
As a result, there was a fresh decline initiated from $178 and the price broke the key $175 support. Similarly, there were bearish moves in bitcoin price after it failed to settle above the $8,200 level. BTC may perhaps continue to move down towards the $7,800 support.
The recent price action in Ethereum pushed it below the $175 and $174 levels. Moreover, there was a close below the $172 support and the 100 hourly simple moving average. The bears pushed the price below the 50% Fib retracement level of the upward move from the $169 swing low to $178 high.
At the outset, the price is testing the $170 level, plus trading well below the 76.4% Fib retracement level of the upward move from the $169 swing low to $178 high. Therefore, there are chances of more downsides below the $170 and $168 support levels.
If there is a break below $170, ETH could test the 1.236 Fib extension level of the upward move from the $169 swing low to $178 high at $167. Having said that, the price is likely to continue lower and trade towards the $162 and $160 support levels.
On the upside, there is a key bearish trend line forming with resistance near $172 on the hourly chart of ETH/USD. Thus, a clear break above the trend line and close above $175 is needed for a fresh increase in the near term.
Looking at the chart, Ethereum price is clearly resuming its downtrend below $175 and $172. The price action is negative, suggesting more downsides below the $170 and $168 support levels. The next major stop for the bears may perhaps be $160.
ETH Technical Indicators
Hourly MACD – The MACD for ETH/USD is gaining pace in the bearish zone.
Hourly RSI – The RSI for ETH/USD is declining and is well below the 40 level.
Major Support Level – $168
Major Resistance Level – $175