
Reason to trust
How Our News is Made
Strict editorial policy that focuses on accuracy, relevance, and impartiality
Ad discliamer
Morbi pretium leo et nisl aliquam mollis. Quisque arcu lorem, ultricies quis pellentesque nec, ullamcorper eu odio.
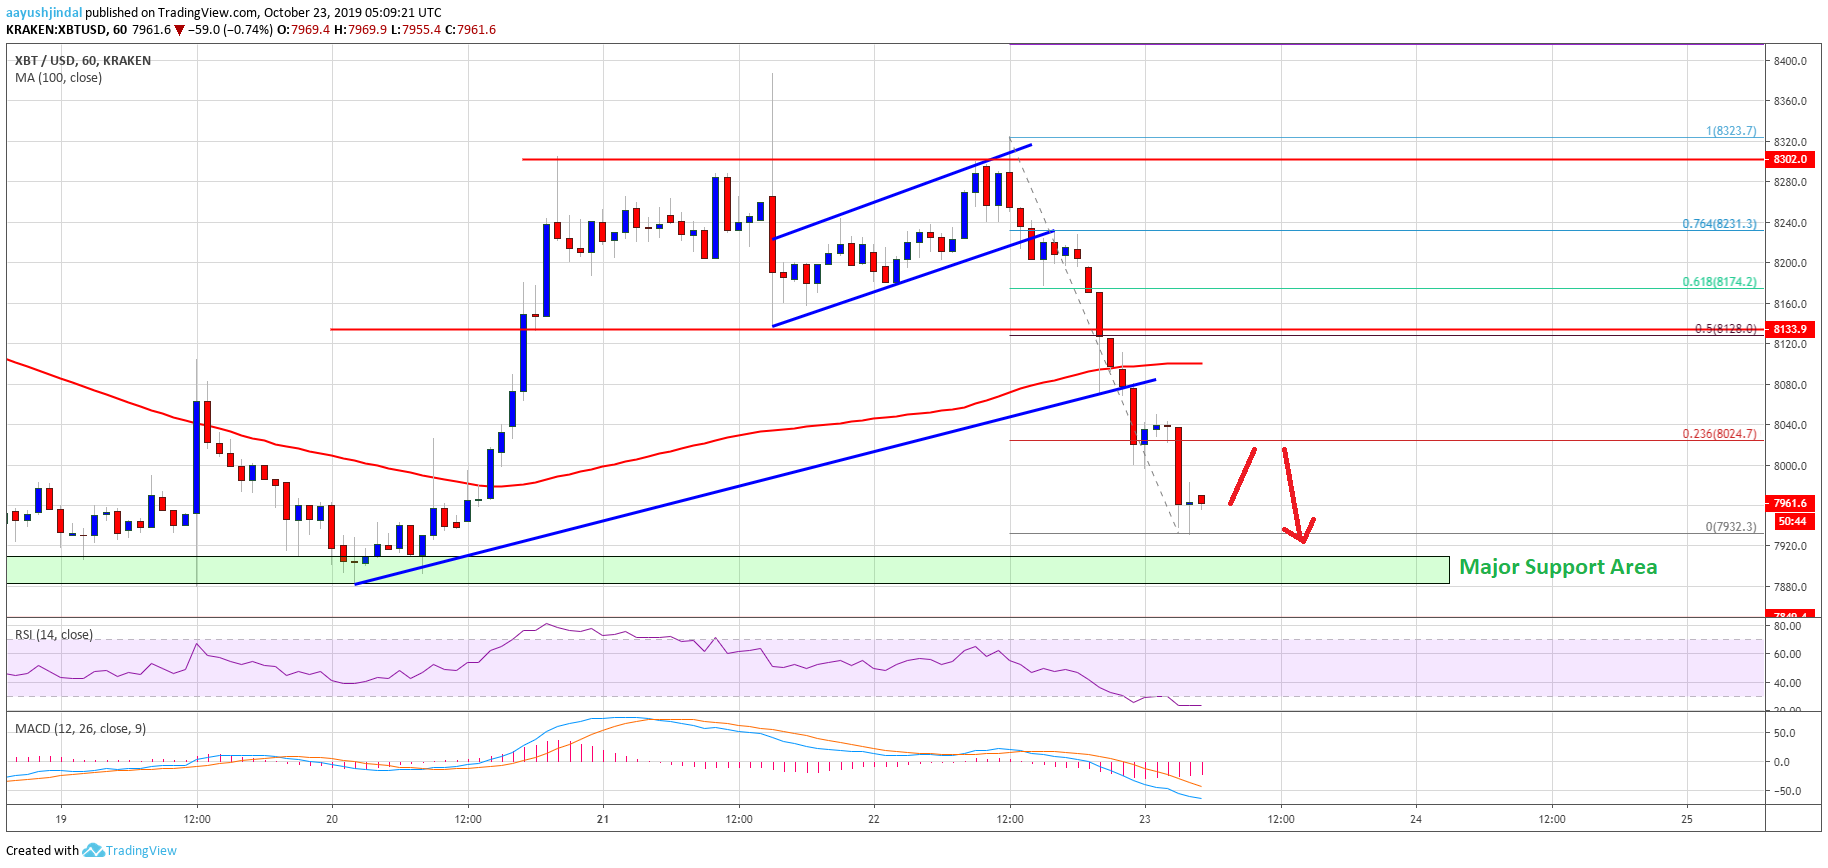
- Bitcoin price is declining after it failed to climb above the key $8,300 resistance against the US Dollar.
- The price is under pressure and it is now trading below the $8,000 support area.
- There was a break below a connecting bullish trend line with support near $8,080 on the hourly chart of the BTC/USD pair (data feed from Kraken).
- The price is approaching a major support area near $7,800, below which there could be a sharp decline.
Bitcoin price is facing a fresh increase in selling pressure below $8,200 against the US Dollar. BTC price could accelerate losses if it fails to stay above $7,800.
Bitcoin Price Analysis
Recently, bitcoin made a few attempts to gain strength above the $8,300 resistance area against the US Dollar. BTC price even spiked above the $8,350 level, but it failed to continue higher.
As a result, a swing high was formed near $8,323 and the price started a fresh decline. During the decline, there was a break below a couple of important supports near $8,100 and $8,200. Moreover, there was a break below a short term ascending channel with support near $8,240 on the hourly chart of the BTC/USD pair.
Finally, bitcoin traded below the $8,100 support area and settled below the 100 hourly simple moving average. It is now trading below the $8,000 level and a low was formed near $7,932.
If there is an upside correction, an immediate resistance is near the $8,000 level. Additionally, the 23.6% Fib retracement level of the recent decline from the $8,323 high to $7,932 low is also near the $8,020 level to act as a resistance.
If there is a decent recovery, the price could test the $8,100 resistance area (the previous support) and the 100 hourly SMA. Besides, the 50% Fib retracement level of the recent decline from the $8,323 high to $7,932 low is near $8,128.
Therefore, the price must climb back above $8,100 and $8,120 to start a fresh increase towards the $8,250 and $8,300 resistance levels. Conversely, if there is no upside break above $8,120, the price could continue to decline in the near term.
Looking at the chart, bitcoin is clearly struggling below $8,020 and $8,120. An immediate support is near the $7,800 area. If the bulls fail to defend the $7,800 support area, there is a risk of a breakdown. The next major support is near the $7,500 area, where the bulls may take a stand.
Technical indicators:
Hourly MACD – The MACD is gaining pace in the bearish zone.
Hourly RSI (Relative Strength Index) – The RSI for BTC/USD is currently in the oversold area.
Major Support Levels – $7,880 followed by $7,800.
Major Resistance Levels – $8,020, $8,100 and $8,120.