
Reason to trust
How Our News is Made
Strict editorial policy that focuses on accuracy, relevance, and impartiality
Ad discliamer
Morbi pretium leo et nisl aliquam mollis. Quisque arcu lorem, ultricies quis pellentesque nec, ullamcorper eu odio.
- Ethereum price is currently struggling to climb above $178 and $180 against the US Dollar.
- Bitcoin price is declining and it seems like it failed to stay above $8,220 and $8,200.
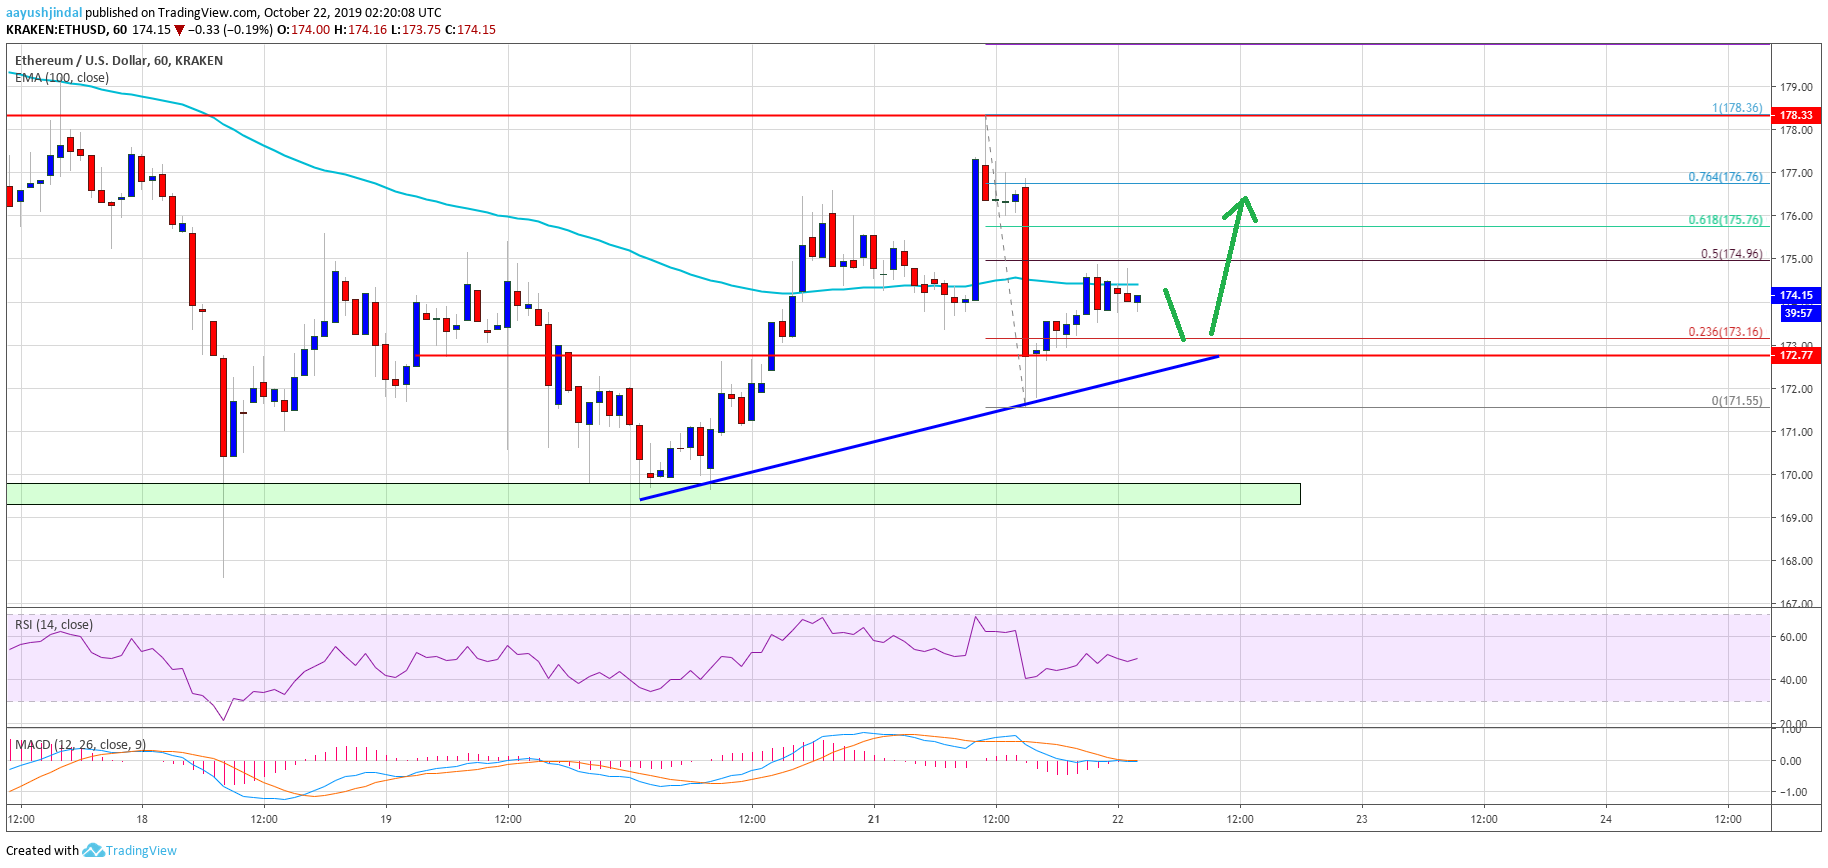
- There is a short term bullish trend line forming with support near $172 on the hourly chart of ETH/USD (data feed via Kraken).
- The pair could recover to $180 as long as there is no close below the $170 support area.
Ethereum price is showing a few bearish signs versus the US Dollar, while bitcoin is declining. ETH price could bounce back as long as the $170 support holds.
Ethereum Price Analysis
Yesterday, we saw a decent recovery in Ethereum above the $175 resistance against the US Dollar. More importantly, bitcoin price gained traction and climbed above the $8,200 resistance area.
However, BTC failed to stay above the $8,220 and $8,000 level. It is currently declining, dragging Ethereum and ripple lower.
Recently, ETH price spiked above the $178 level, but it failed to continue higher. As a result, there was a fresh decline and the price declined below $175. A low was formed near $171.55 and the price is currently correcting higher.
It recovered above the 23.6% Fib retracement level of the recent decline from the $178 high to $171 swing low. At the moment, it is consolidating near the $175 resistance and the 100 hourly simple moving average. Besides, it seems like the 50% Fib retracement level of the recent decline from the $178 high to $171 swing low is acting as a resistance.
If there is an upside break above the $175 resistance, the price could recover towards the $178 resistance area. Having said that, a clear break above the $178 and $180 resistance levels is must for a steady rise in the near term.
On the downside, there are many supports near the $172 and $170 levels. Additionally, there is a short term bullish trend line forming with support near $172 on the hourly chart of ETH/USD. If there is a downside break below the trend line, the price could even decline below the $170 support.
Looking at the chart, Ethereum price is clearly trading in a broad range between $170 and $180. A clear break and close on either side might set the pace for the next move. As long as there is no daily close below $170, there are chances of an increase above the $178 and $180 resistance levels in the near term.
ETH Technical Indicators
Hourly MACD – The MACD for ETH/USD is slowly moving into the bullish zone.
Hourly RSI – The RSI for ETH/USD is currently above 50 and is moving higher.
Major Support Level – $170
Major Resistance Level – $178


