Reason to trust
How Our News is Made
Strict editorial policy that focuses on accuracy, relevance, and impartiality
Ad discliamer
Morbi pretium leo et nisl aliquam mollis. Quisque arcu lorem, ultricies quis pellentesque nec, ullamcorper eu odio.
- Ripple price started a fresh increase and it surged above $0.3000 against the US dollar.
- The price is currently correcting higher after trading to a new monthly high near $0.3040.
- Earlier, there was a break above a declining channel with resistance near $0.2860 on the hourly chart of the XRP/USD pair (data source from Kraken).
- The price is slowly correcting lower and it could find bids near the $0.2940 and $0.2920 levels.
Ripple price is moving nicely in a positive zone against the US Dollar and bitcoin. XRP price remains in an uptrend above $0.2900, while ETH and BTC are struggling.
Ripple Price Analysis
Yesterday, we saw a downside correction in ripple below the $0.2850 support area against the US Dollar. XRP price traded as low as $0.2783 and recently started a fresh increase. It is up more than 4% and cleared many hurdles near the $0.2900 and $0.2920 resistance levels. Moreover, there was a close above the $0.2900 level and the 100 hourly simple moving average.
During the rise, there was a break above a declining channel with resistance near $0.2860 on the hourly chart of the XRP/USD pair. The pair gained momentum above the $0.2950 and $0.3000 resistance levels. A new monthly high is formed near $0.3040 and the price is currently correcting. It is trading below the 23.6% Fib retracement level of the recent wave from the $0.2783 low to $0.3040 high.
On the downside, an immediate support is near the $0.2940 level. However, the main support is near the $0.2920 level. Additionally, the 50% Fib retracement level of the recent wave from the $0.2783 low to $0.3040 high is also near the $0.2915 level to provide support. If there are more downsides, ripple price could revisit the $0.2880 support area and the 100 hourly SMA.
On the upside, an initial resistance is near the $0.3000 and $0.3020 levels. If there is a successful close above $0.3020, the price could surge above the $0.3040 and $0.3050 levels in the near term. The next stop on the upside is near the $0.3100 level.
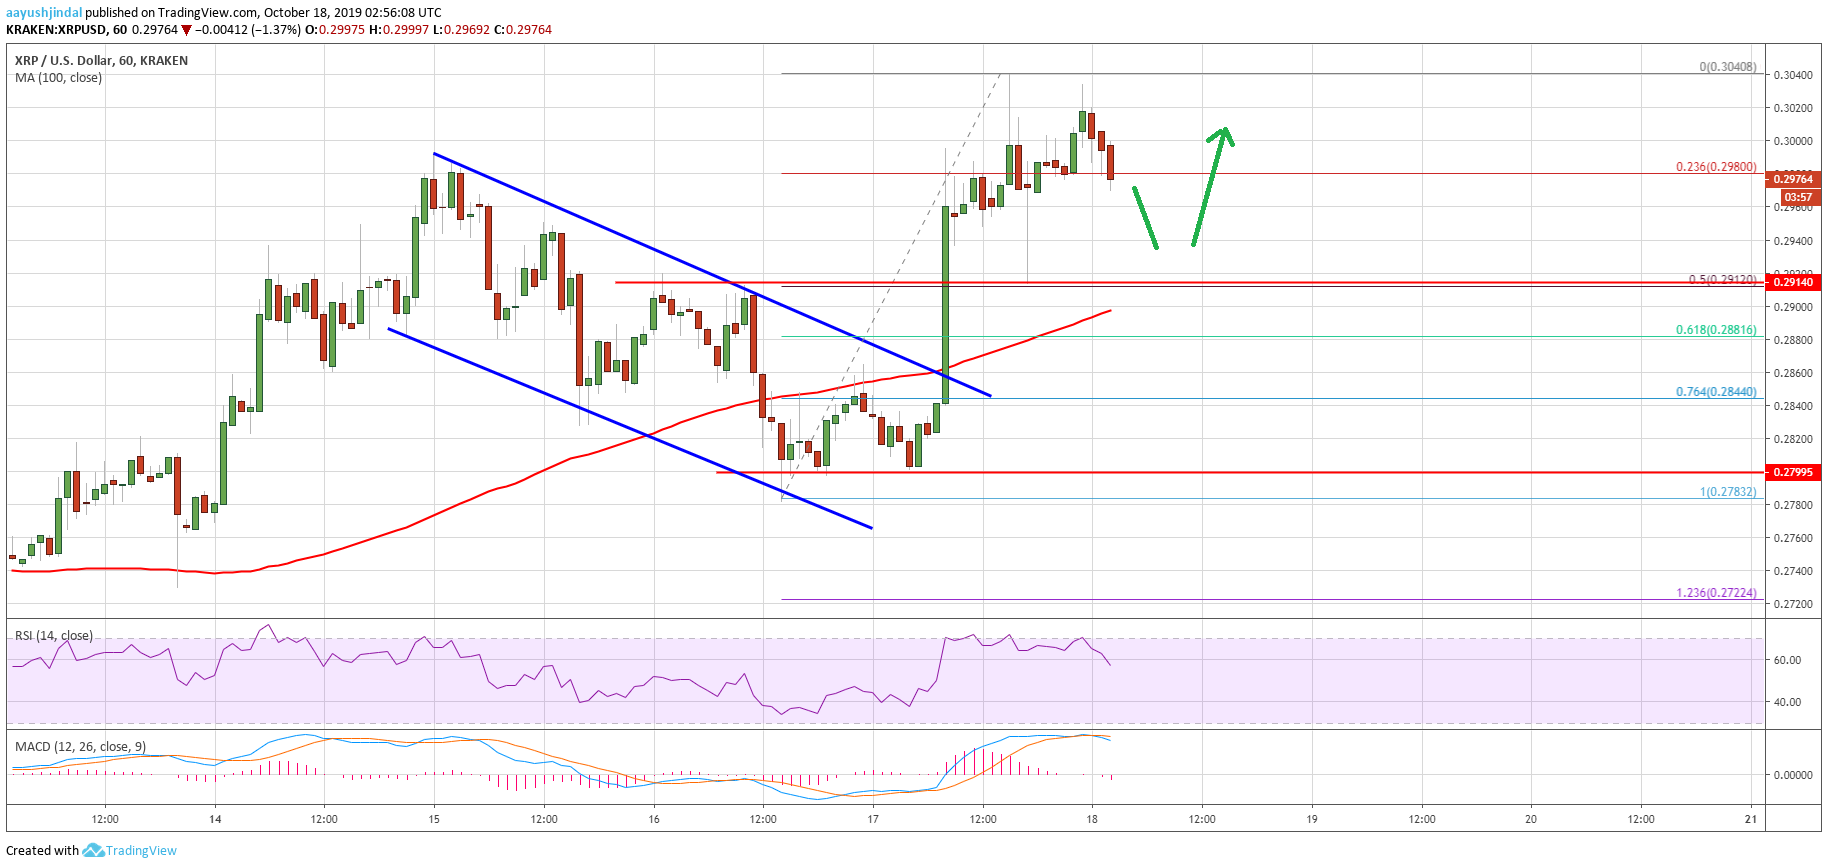
Looking at the chart, ripple price is showing a lot of positive signs above the $0.2920 support area. Therefore, there are high chances of a decent upward move above the $0.3000 in the coming sessions. Only a close below $0.2880 may perhaps negate the current positive bias and start a fresh decline.
Technical Indicators
Hourly MACD – The MACD for XRP/USD is gaining strength in the bearish zone.
Hourly RSI (Relative Strength Index) – The RSI for XRP/USD is currently correcting lower towards the 50 level.
Major Support Levels – $0.2940, $0.2920 and $0.2880.
Major Resistance Levels – $0.3000, $0.3020 and $0.3040.


