
Reason to trust
How Our News is Made
Strict editorial policy that focuses on accuracy, relevance, and impartiality
Ad discliamer
Morbi pretium leo et nisl aliquam mollis. Quisque arcu lorem, ultricies quis pellentesque nec, ullamcorper eu odio.
- Ethereum price is currently correcting higher, but it is facing a strong resistance near $180 against the US Dollar.
- Bitcoin price is up more than 1.5%, but it is also facing resistance $8,120 and $8,200.
- This week’s followed major bearish trend line was breached with resistance near $174 on the hourly chart of ETH/USD (data feed via Kraken).
- The pair is clearly facing a strong resistance near the $180 level and the 100 hourly SMA.
Ethereum price is currently recovering higher versus the US Dollar, similar to bitcoin. However, ETH price must settle above $180 to continue higher in the near term.
Ethereum Price Analysis
Yesterday, we saw an extended decline in Ethereum below the $180 support against the US Dollar. Moreover, ETH price settled below the $180 support and the 100 hourly simple moving average. The decline was such that the price traded close to the $170 level. A swing low was formed near $171 before the price started an upside correction. It recovered above the $174 and $175 resistances.
Additionally, this week’s followed major bearish trend line was breached with resistance near $174 on the hourly chart of ETH/USD. The pair climbed above the 23.6% Fib retracement level of the last decline from the $188 high to $171 low. Finally, the price spiked above the $178 resistance area. However, the upward move is facing hurdle near the $180 resistance and the 100 hourly simple moving average.
Moreover, the price failed to test the 50% Fib retracement level of the last decline from the $188 high to $171 low. Ethereum retreated from highs and it is currently trading below $178. It seems like the $180 area and the 100 hourly SMA are crucial barriers. Therefore, a successful close above $180 could push the bulls to continue higher in the near term.
If not, there is a risk of another decline below the $175 level. The main support is near the $172 and $170 levels. If there are more downsides, the price is likely to accelerate its decline below the $165 level. The next key support is near the $160 level.
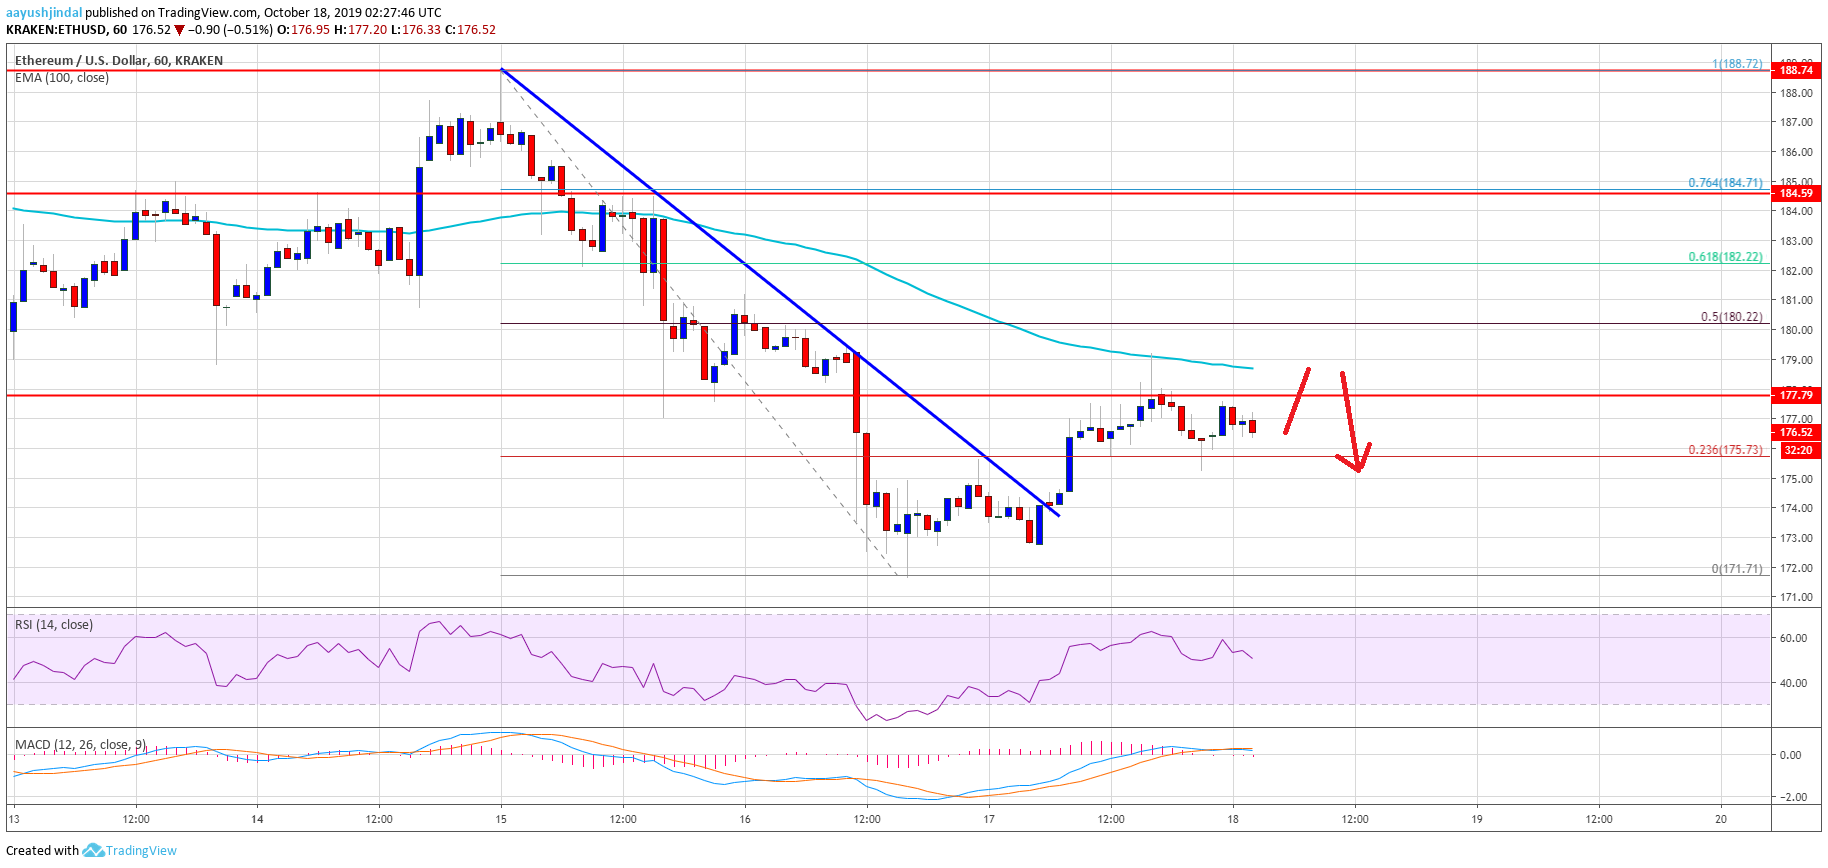
Looking at the chart, Ethereum price is facing a strong resistance near the $180 level and the 100 hourly SMA. If there is a successful close above $180, the price could recover towards the $185 level. An intermediate resistance is near the 61.8% Fib retracement level of the last decline from the $188 high to $171 low.
ETH Technical Indicators
Hourly MACD – The MACD for ETH/USD is likely to move into the bearish zone.
Hourly RSI – The RSI for ETH/USD is currently moving lower towards the 50 level.
Major Support Level – $170
Major Resistance Level – $180


