
Reason to trust
How Our News is Made
Strict editorial policy that focuses on accuracy, relevance, and impartiality
Ad discliamer
Morbi pretium leo et nisl aliquam mollis. Quisque arcu lorem, ultricies quis pellentesque nec, ullamcorper eu odio.
- Bitcoin price corrected higher, but it faced hurdles near $8,120 and $8,140 against the US Dollar.
- The price is declining again and it could gain momentum below the $8,000 support.
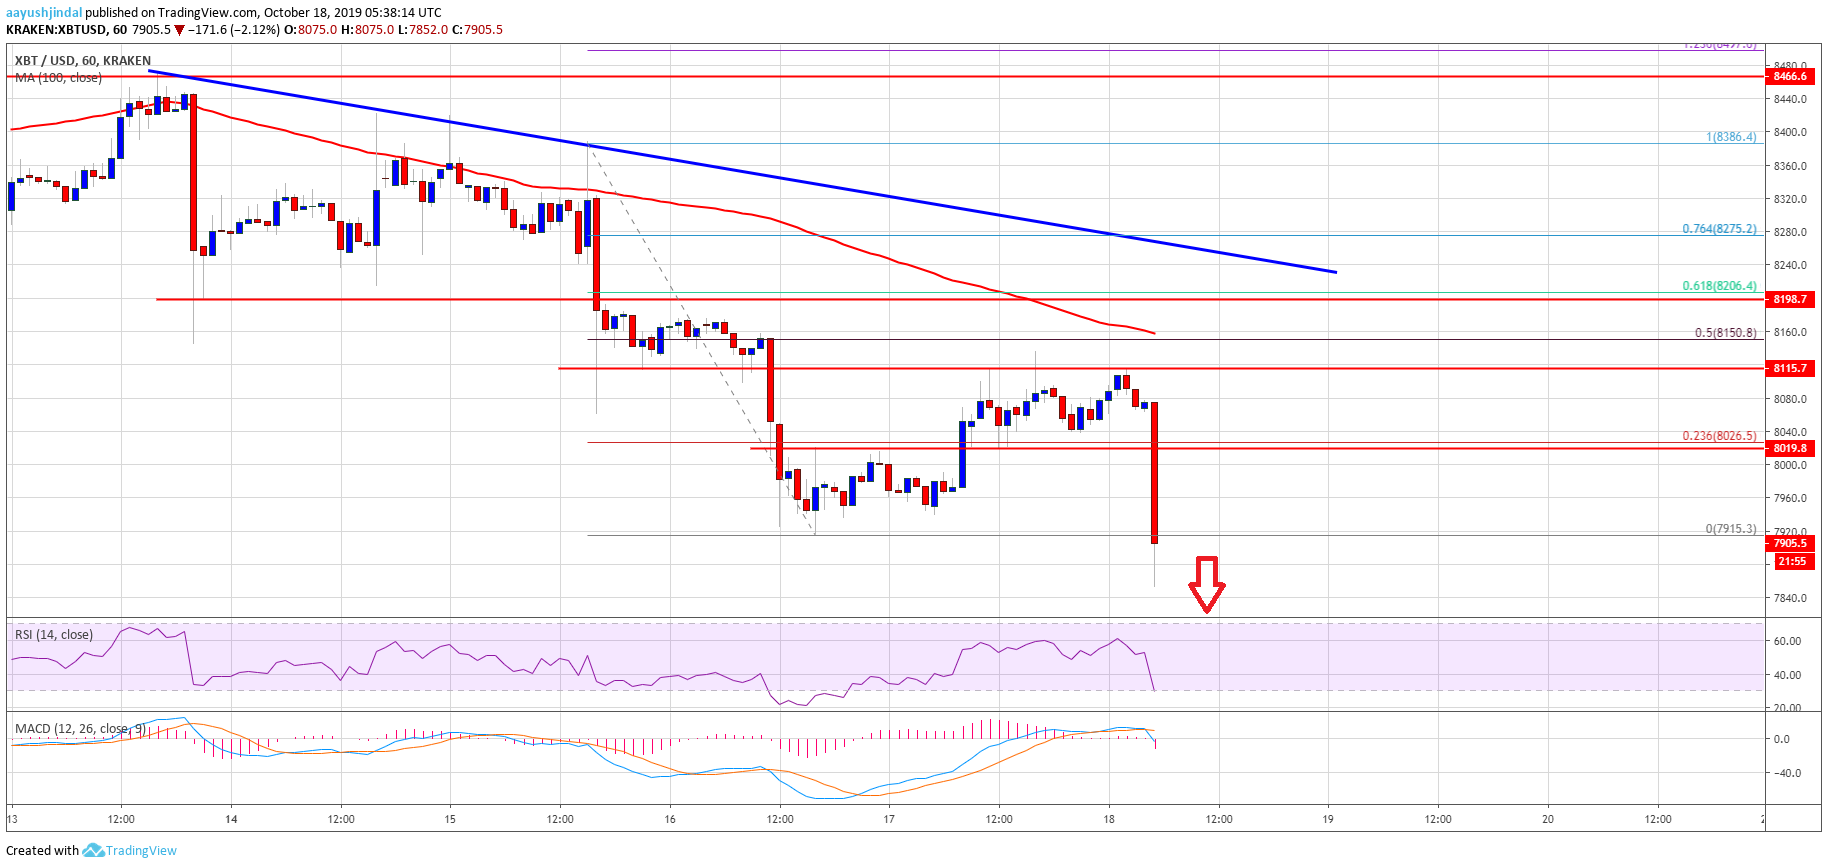
- There is a major bearish trend line forming with resistance near $8,240 on the hourly chart of the BTC/USD pair (data feed from Kraken).
- The price is likely to remain in a bearish zone unless the bulls push it above $8,120 and $8,240.
Bitcoin price is struggling to rebound above $8,100 against the US Dollar. Therefore, BTC is likely to resume its decline below $8,000 and $7,900 in the near term.
Bitcoin Price Analysis
Yesterday, there was a downside extension in bitcoin below the $8,000 support area against the US Dollar. BTC price traded to a new monthly low at $7,915 and settled below the 100 hourly simple moving average. Recently, there was an upside correction above the $8,000 level. Moreover, the price recovered above the $8,020 level, plus the 23.6% Fib retracement level of the last decline from the $8,386 high to $7,915 low.
However, the upward move was capped by the $8,100 and $8,120 resistance levels. Besides, the price failed to test the 50% Fib retracement level of the last decline from the $8,386 high to $7,915 low. As a result, there was a fresh decline below $8,020. The price is now accelerating declines below the $8,000 level. It even broke the last swing low at $7,915 and traded to a new monthly low near $7,850.
It seems like there was a strong bearish reaction below $8,000. The next key support is near the $7,800 level. If there are more downsides, bitcoin price could accelerate losses towards the $7,600 and $7,500 levels in the near term. An intermediate support is near the $7,720 level.
On the upside, the $8,000 and $8,020 levels are likely to act as hurdles for the bulls. The main resistance is near the $8,120 level and the 100 hourly simple moving average. Besides, there is a major bearish trend line forming with resistance near $8,240 on the hourly chart of the BTC/USD pair.
Looking at the chart, bitcoin is clearly under a lot of pressure below $8,120 and $8,000. As long as there is no close above $8,120 and $8,240, there are chances of more downsides. The main target for the bearish in the coming sessions could be near the $7,600 and $7,500 levels.
Technical indicators:
Hourly MACD – The MACD is gaining momentum in the bearish zone.
Hourly RSI (Relative Strength Index) – The RSI for BTC/USD is declining sharply and is well below the 40 level.
Major Support Levels – $7,800 followed by $7,500.
Major Resistance Levels – $8,020, $8,120 and $8,150.