Reason to trust
How Our News is Made
Strict editorial policy that focuses on accuracy, relevance, and impartiality
Ad discliamer
Morbi pretium leo et nisl aliquam mollis. Quisque arcu lorem, ultricies quis pellentesque nec, ullamcorper eu odio.
- Ripple price failed to hold the key $0.2850 support and extended its decline against the US dollar.
- The price is currently correcting higher, but it is likely to face sellers near $0.2850 and $0.2880.
- This week’s followed key bullish trend line was breached with support near $0.2855 is intact on the hourly chart of the XRP/USD pair (data source from Kraken).
- The price is now facing a strong resistance near the $0.2860 and $0.2880 levels.
Ripple price is struggling to hold gains against the US Dollar and bitcoin. XRP price is currently under pressure and it could continue to move down towards $0.2750.
Ripple Price Analysis
In the past few hours, there was an increase in selling for bitcoin, ripple and Ethereum against the US Dollar. XRP price failed to hold a couple of important supports such as $0.2880 and $0.2850. As a result, there was a bearish break below the $0.2850 support area. Moreover, there was a close below the $0.2850 support and the 100 hourly simple moving average.
More importantly, this week’s followed key bullish trend line was breached with support near $0.2855 is intact on the hourly chart of the XRP/USD pair. The pair even spiked below $0.2800 and traded as low as $0.2782. Recently, the price started an upside correction above the $0.2800 level. Additionally, there was a break above the 23.6% Fib retracement level of the recent drop from the $0.2992 high to $0.2782 low.
However, the previous support near the $0.2850 level is acting as a resistance. Moreover, the 100 hourly SMA is preventing recovery above $0.2860. There is also a connecting bearish trend line forming with resistance near $0.2860 on the same chart. Therefore, an upside break above the $0.2860 and $0.2880 is needed for a fresh increase in ripple in the near term.
On the downside, an immediate support is near the $0.2800 level. If the price fails to hold the $0.2800 support, there are chances of an extended decline below $0.2780. The next major support is near the $0.2750 level, below which the price could even trade towards the $0.2720 level.
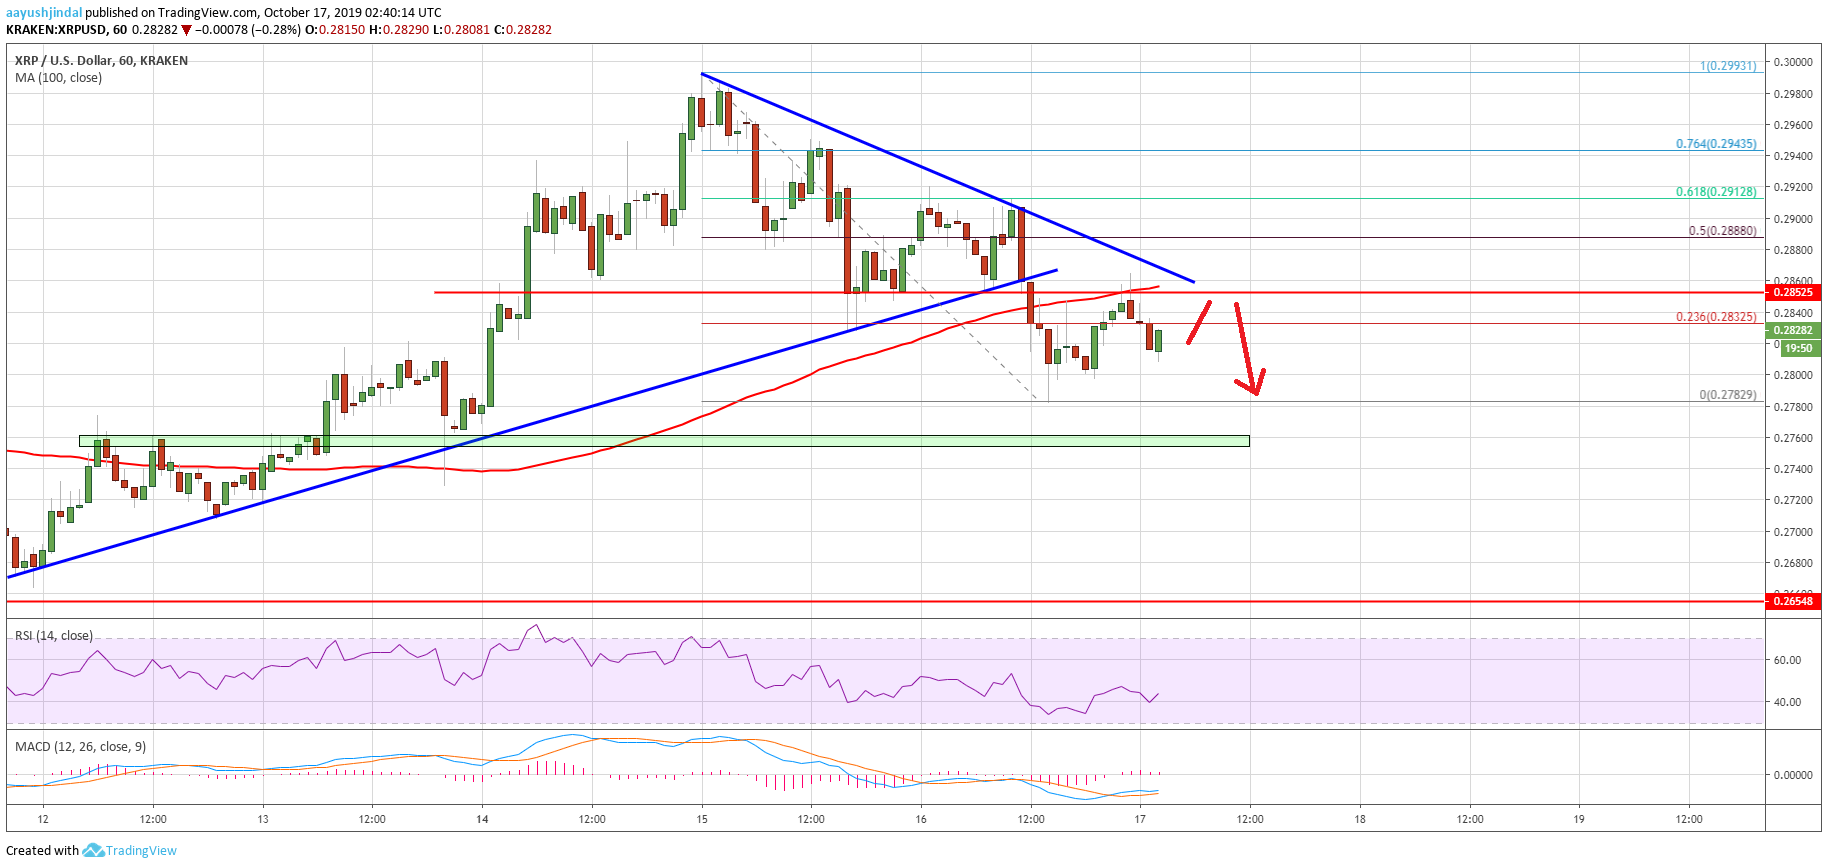
Looking at the chart, ripple price seems to be struggling to clear the $0.2850 resistance. If the bulls continue to face resistance near $0.2860 and $0.2850, the price could resume its decline. Conversely, a successful break above $0.2860 may perhaps push the price towards the $0.2920 level in the near term.
Technical Indicators
Hourly MACD – The MACD for XRP/USD is struggling to stay in the bullish zone.
Hourly RSI (Relative Strength Index) – The RSI for XRP/USD is currently just above the 40 level.
Major Support Levels – $0.2800, $0.2780 and $0.2750.
Major Resistance Levels – $0.2850, $0.2860 and $0.2920.