
Reason to trust
How Our News is Made
Strict editorial policy that focuses on accuracy, relevance, and impartiality
Ad discliamer
Morbi pretium leo et nisl aliquam mollis. Quisque arcu lorem, ultricies quis pellentesque nec, ullamcorper eu odio.
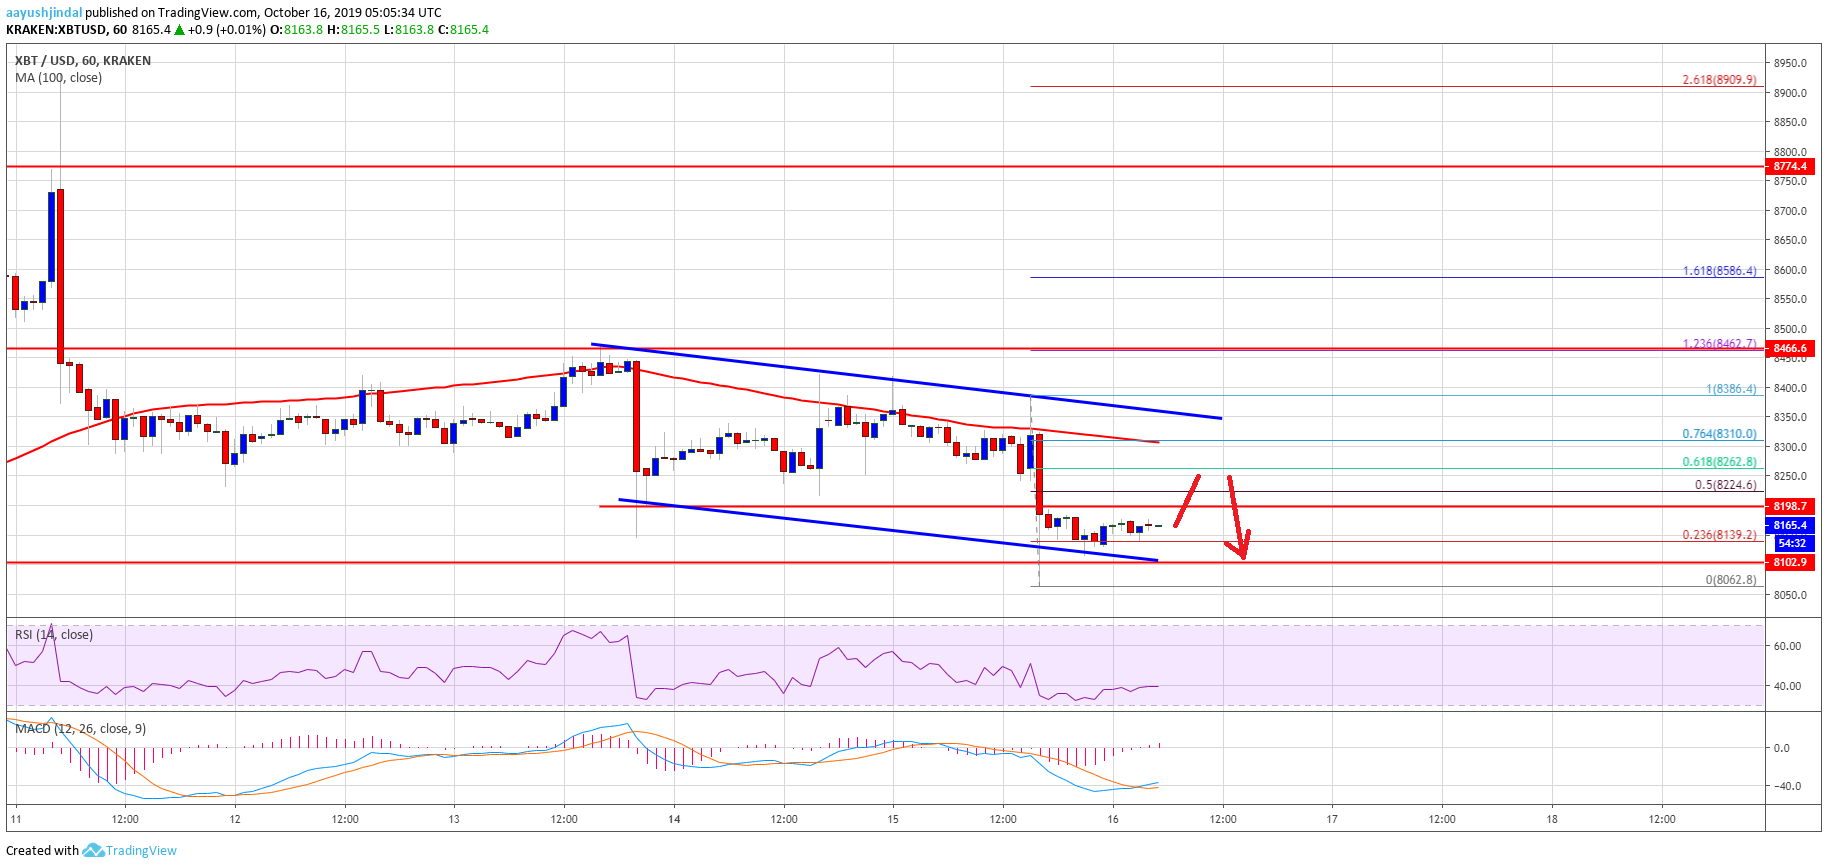
- Bitcoin price failed to rebound above $8,300 and extended its decline against the US Dollar.
- The price is trading below the $8,200 level and recently it declined towards the $8,050 level.
- There is a key declining channel forming with resistance near $8,350 on the hourly chart of the BTC/USD pair (data feed from Kraken).
- The price remains at a risk of more losses as long as it is trading below $8,400 and $8,500.
Bitcoin price is showing signs of additional weakness below $8,200 against the US Dollar. BTC could accelerate decline if it continues to struggle near $8,400.
Bitcoin Price Analysis
Yesterday, we discussed the chances of a possible rebound in bitcoin if it breaks the $8,400 resistance against the US Dollar. However, BTC price struggled to climb above the $8,400 resistance area. As a result, there was a fresh decline below the $8,300 level. Moreover, there was a break below the key $8,200 support area and the 100 hourly simple moving average.
Finally, the price traded below the $8,100 level and formed a new weekly low near $8,062. It is currently consolidating losses above the $8,100 level. Besides, it traded above the 23.6% Fib retracement level of the recent decline from the $8,386 high to $8,062 low. An immediate resistance is near the $8,200 level (the recent key support). The next resistance is near the $8,220 level and the 50% Fib retracement level of the recent decline from the $8,386 high to $8,062 low.
However, the main resistance for bitcoin is near the $8,300 level and the 100 hourly SMA. Furthermore, there is a key declining channel forming with resistance near $8,350 on the hourly chart of the BTC/USD pair. Therefore, a successful break above the channel resistance and a follow through above $8,400 is must for a decent recovery in the near term.
On the downside, there are not many supports up to $8,000. If the bears gain strength, they may perhaps succeed in clearing the $8,000 support area. The next major support is near the $7,800 level, below which the price is likely to head towards the $7,500 zone.
Looking at the chart, bitcoin is clearing struggling to recover above the $8,400 level. If the bulls continue to struggle, there is a risk of a bearish reaction below the $8,050 and $8,000 levels. In the mentioned case, the price could even struggle to stay above the $7,800 support area.
Technical indicators:
Hourly MACD – The MACD is struggling to gain strength in the bullish zone.
Hourly RSI (Relative Strength Index) – The RSI for BTC/USD is now well below the 40 level.
Major Support Levels – $8,000 followed by $7,800.
Major Resistance Levels – $8,350, $8,400 and $8,500.


