Reason to trust
How Our News is Made
Strict editorial policy that focuses on accuracy, relevance, and impartiality
Ad discliamer
Morbi pretium leo et nisl aliquam mollis. Quisque arcu lorem, ultricies quis pellentesque nec, ullamcorper eu odio.
- Ripple price is showing positive signs and it recently gained pace above $0.2800 against the US dollar.
- The price is up around 4% and it is currently testing the key $0.2850 resistance area.
- There is a major bullish trend line forming with support near $0.2770 on the hourly chart of the XRP/USD pair (data source from Kraken).
- The price could correct lower in the short term, but dips remain supported near $0.2770 and $0.2750.
Ripple price is gaining bullish momentum against the US Dollar, bitcoin and Ethereum. XRP price must surpass $0.2850 to continue higher in the near term.
Ripple Price Analysis
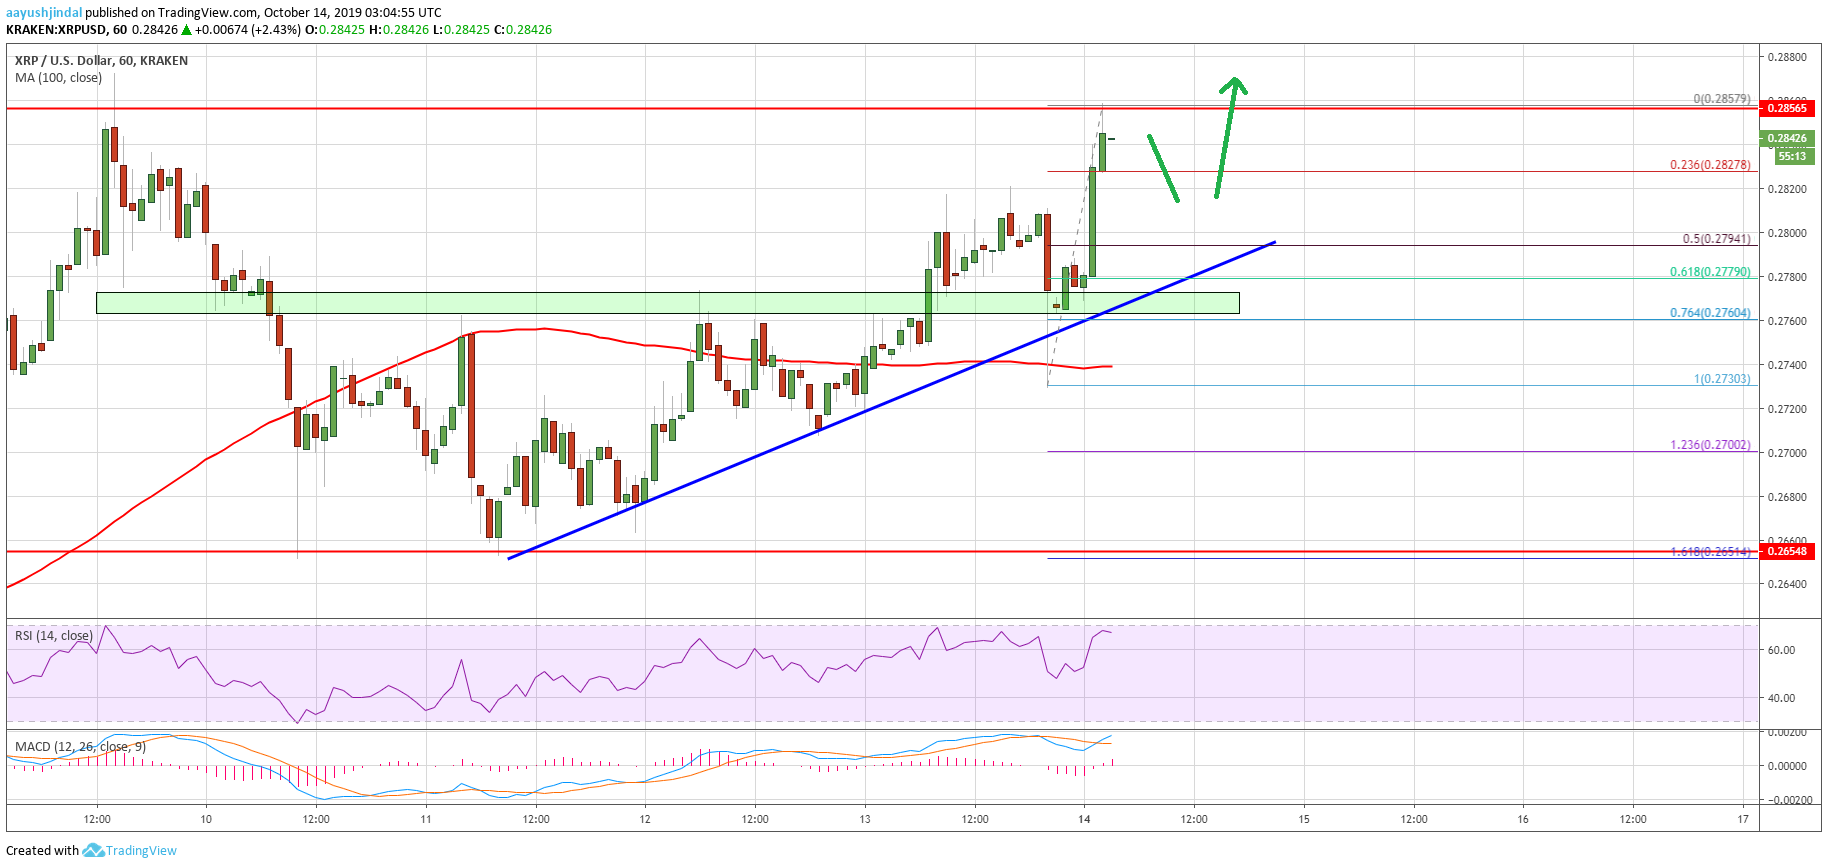
This past week, there was a sharp correction in ripple price below the $0.2750 support area against the US Dollar. XRP price even broke the $0.2700 level before the bulls took a stand near the $0.2650 support area. Later, a support base was formed near $0.2650 and recently the price started a fresh increase. It broke the $0.2700 and $0.2750 resistance levels to move into a positive zone.
Moreover, there was a close above the $0.2750 level and the 100 hourly simple moving average. The price tested the key $0.2850 resistance area and formed a high near $0.2857. At the moment, the price is consolidating gains near the $0.2850 resistance. An immediate support is near the $0.2820 level. It coincides with the 23.6% Fib retracement level of the recent wave from the $0.2730 low to $0.2857 high.
However, there are many supports on the downside for ripple near the $0.2800 and $0.2780 levels. Additionally, the 50% Fib retracement level of the recent wave from the $0.2730 low to $0.2857 high is near the $0.2800 level. More importantly, there is a major bullish trend line forming with support near $0.2770 on the hourly chart of the XRP/USD pair.
The trend line coincides with the 61.8% Fib retracement level of the recent wave from the $0.2730 low to $0.2857 high. The main support is near the $0.2750 level, below which the price could resume its decline towards the $0.2650 and $0.2600 support levels. On the upside, the main resistance is near the $0.2850 level. A convincing close above the $0.2850 resistance might set the pace for more gains towards $0.2950 and $0.3000.
Looking at the chart, ripple price is clearly showing positive signs above $0.2750, while bitcoin and Ethereum are struggling to climb higher. Therefore, there are high chances of more gains above the $0.2850 resistance.
Technical Indicators
Hourly MACD – The MACD for XRP/USD is moving nicely in the bullish zone.
Hourly RSI (Relative Strength Index) – The RSI for XRP/USD is currently well above the 50 level.
Major Support Levels – $0.2800, $0.2780 and $0.2750.
Major Resistance Levels – $0.2850, $0.2920 and $0.2950.


