
Reason to trust
How Our News is Made
Strict editorial policy that focuses on accuracy, relevance, and impartiality
Ad discliamer
Morbi pretium leo et nisl aliquam mollis. Quisque arcu lorem, ultricies quis pellentesque nec, ullamcorper eu odio.
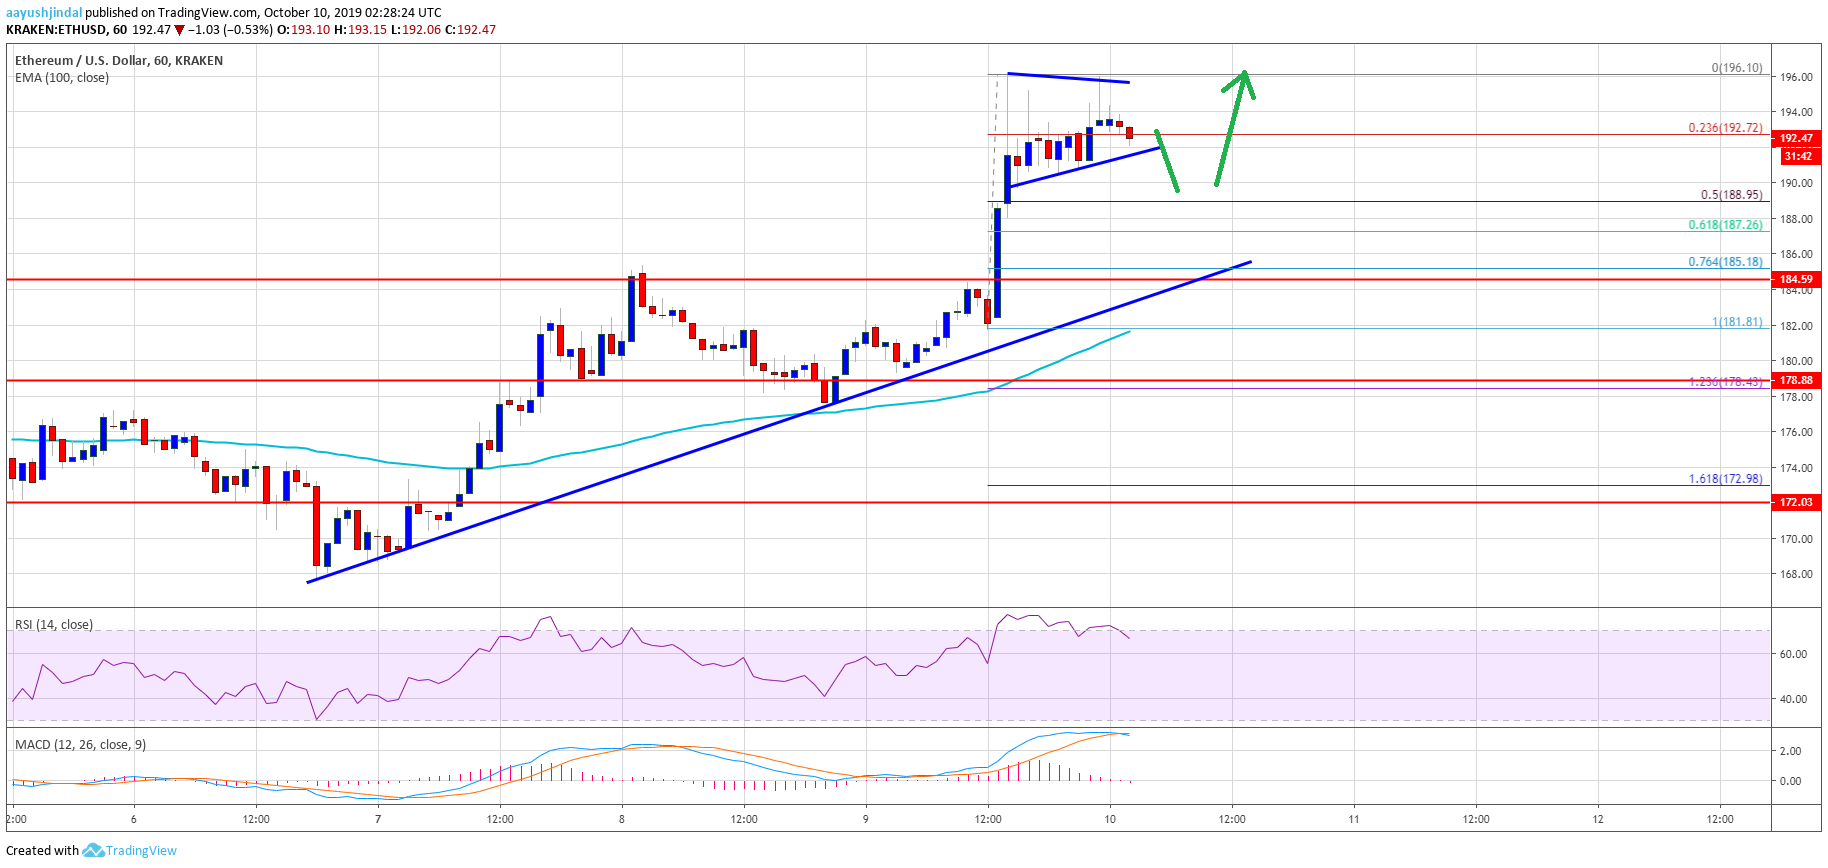
- ETH price surged higher and broke the key $185 resistance against the US Dollar.
- The price is currently correcting lower after setting a new monthly high near the $196 level.
- There is a short term breakout pattern forming with support near $191 on the hourly chart of ETH/USD (data feed via Kraken).
- The pair could correct lower towards $190 or even $185 before a fresh increase in the near term.
Ethereum price is showing a lot of positive signs versus the US Dollar and bitcoin. ETH price is now trading nicely above $185 and it could soon test $200.
Ethereum Price Analysis
After a minor downside correction, Ethereum started a fresh increase from the $175 support against the US Dollar. ETH price surged above the $180 and $185 resistance levels. Moreover, there was a close above the $185 resistance and the 100 hourly simple moving average. The upward move was such that the price even surpassed the $190 level and traded to a new monthly high near $196.
At the moment, the price is consolidating gains below the $195 level. It is trading near the 23.6% Fib retracement level of the recent rally from the $181 low to $196 high. Moreover, there is a short term breakout pattern forming with support near $191 on the hourly chart of ETH/USD. If there is a downside break below the $191 and $190 levels, the price could extend its correction.
The next key support is near the $188 level. It coincides with the 50% Fib retracement level of the recent rally from the $181 low to $196 high. If the price fails to stay above $188, it could test the $185 support area (the previous resistance area). Additionally, yesterday’s highlighted bullish trend line with current support near the $186 level is intact and it is likely to provide support.
On the upside, an immediate resistance is near the $195 level. A convincing break above the $195 level may perhaps push the price towards the next important resistance near $200, above which the price could even test $205.
Looking at the chart, Ethereum price is clearly trading in an uptrend above the $185 support area. In the short term, there could be a downside correction towards $190 or $185. Overall, the price remains well supported and it is likely to continue higher above the $195 resistance. The next stop for the bulls might be $200 or $205.
ETH Technical Indicators
Hourly MACD – The MACD for ETH/USD is currently reducing its bullish slope.
Hourly RSI – The RSI for ETH/USD is currently well above the 60 level, with a lot of positive signs.
Major Support Level – $190
Major Resistance Level – $195