
Reason to trust
How Our News is Made
Strict editorial policy that focuses on accuracy, relevance, and impartiality
Ad discliamer
Morbi pretium leo et nisl aliquam mollis. Quisque arcu lorem, ultricies quis pellentesque nec, ullamcorper eu odio.
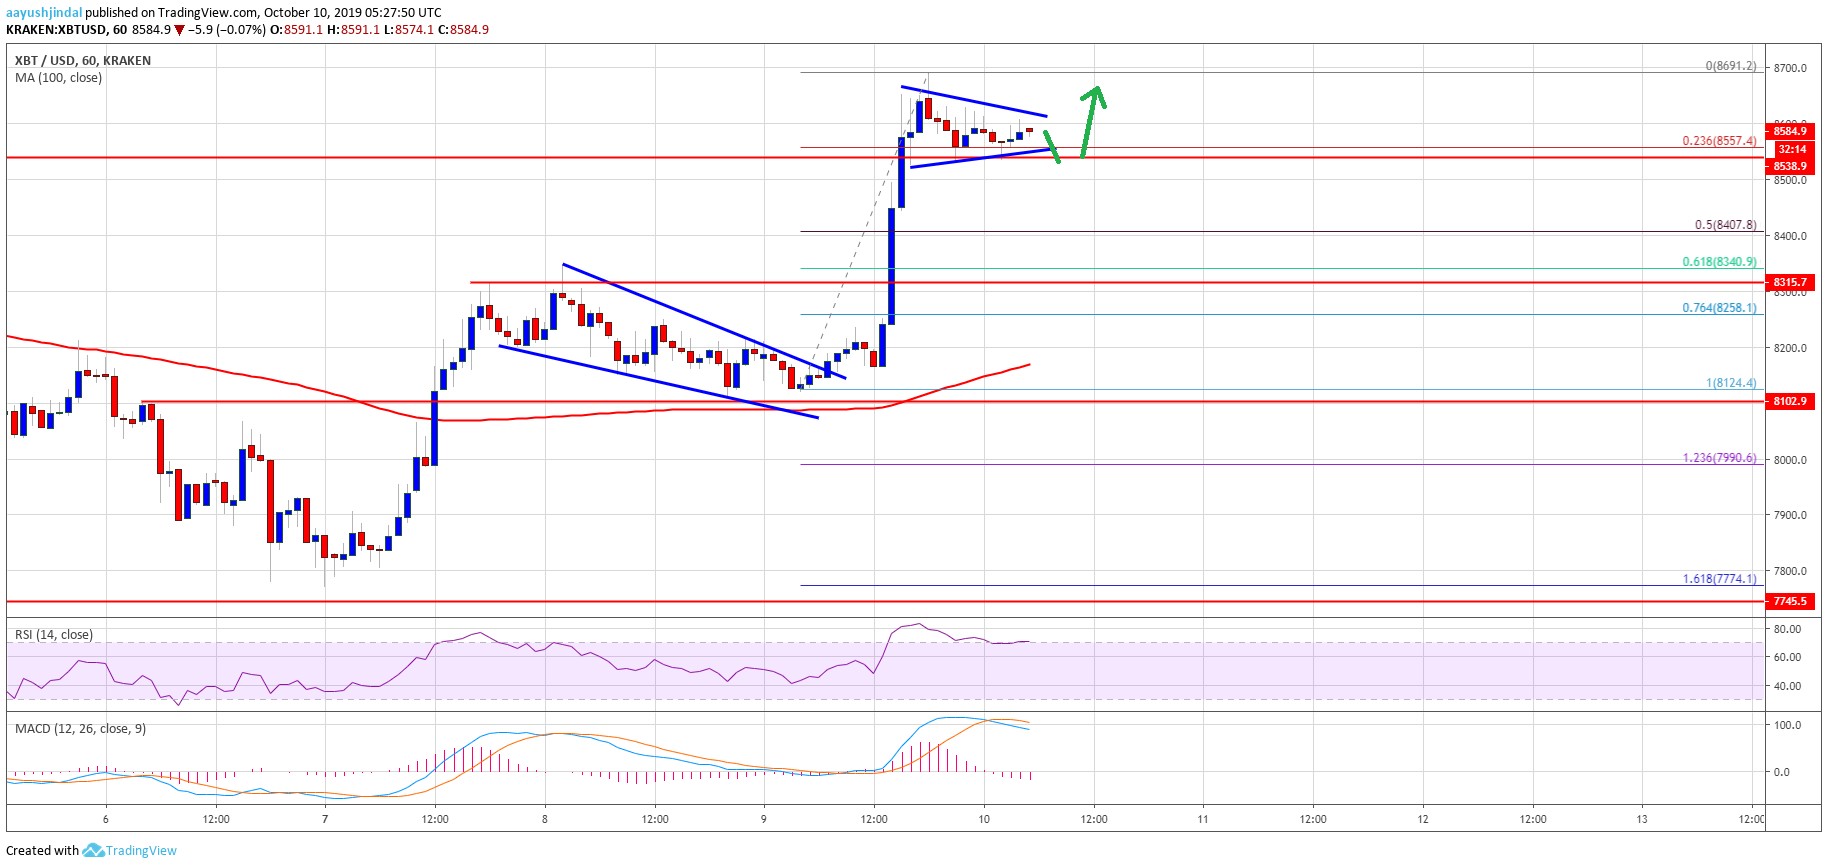
- Bitcoin price is up more than 5% and it broke the key $8,500 resistance against the US Dollar.
- The price is currently consolidating gains above the $8,500 and $8,400 support levels.
- There is a short term breakout pattern forming with support near $8,540 on the hourly chart of the BTC/USD pair (data feed from Kraken).
- The price is showing a lot of positive signs and it could continue to rise above $8,600 and $8,750.
Bitcoin price is back in a positive zone above $8,500 against the US Dollar. BTC could correct in the short term, but it remains well supported above $8,350.
Bitcoin Price Analysis
Yesterday, we saw a minor downside correction in BTC below the $8,200 support area against the US Dollar. We also discussed a possible bounce as long as the price holds the $8,000 support area and the 100 hourly simple moving average. The price did stay above $8,000 and recently started a strong upward move. It is up more than 5% and surpassed the $8,350 resistance. Moreover, there was a break above the key $8,500 resistance area.
A new weekly high was formed near $8,691 and the price is currently consolidating gains. It corrected below the $8,600 level. However, the 23.6% Fib retracement level of the recent rally from the $8124 low to $8,691 high is acting as a decent support. Additionally, there is a short term breakout pattern forming with support near $8,540 on the hourly chart of the BTC/USD pair.
If there is a downside break below the $8,540 and $8,500 support levels, the price could extend its correction. The next key support is near the $8,400 level. Moreover, the 50% Fib retracement level of the recent rally from the $8124 low to $8,691 high is also near the $8,407 level. If there are any additional losses, the price may perhaps test the $8,350 support area (the recent key resistance).
The 61.8% Fib retracement level of the recent rally from the $8124 low to $8,691 high is also near the $8,340 level to provide support. On the upside, an immediate resistance is near the $8,620 level. If there is an upside break above $8,620 and $8,650, the price is likely to accelerate towards the $8,800 level.
Looking at the chart, bitcoin is clearly trading in a positive zone above the $8,500 pivot level. In the short term, there could be a downside correction, but the $8,400 and $8,350 levels are likely to protect losses.
Technical indicators:
Hourly MACD – The MACD is slowly moving in the bearish zone.
Hourly RSI (Relative Strength Index) – The RSI for BTC/USD is still well above the 60 level.
Major Support Levels – $8,540 followed by $8,400.
Major Resistance Levels – $8,620, $8,700 and $8,800.