Reason to trust
How Our News is Made
Strict editorial policy that focuses on accuracy, relevance, and impartiality
Ad discliamer
Morbi pretium leo et nisl aliquam mollis. Quisque arcu lorem, ultricies quis pellentesque nec, ullamcorper eu odio.
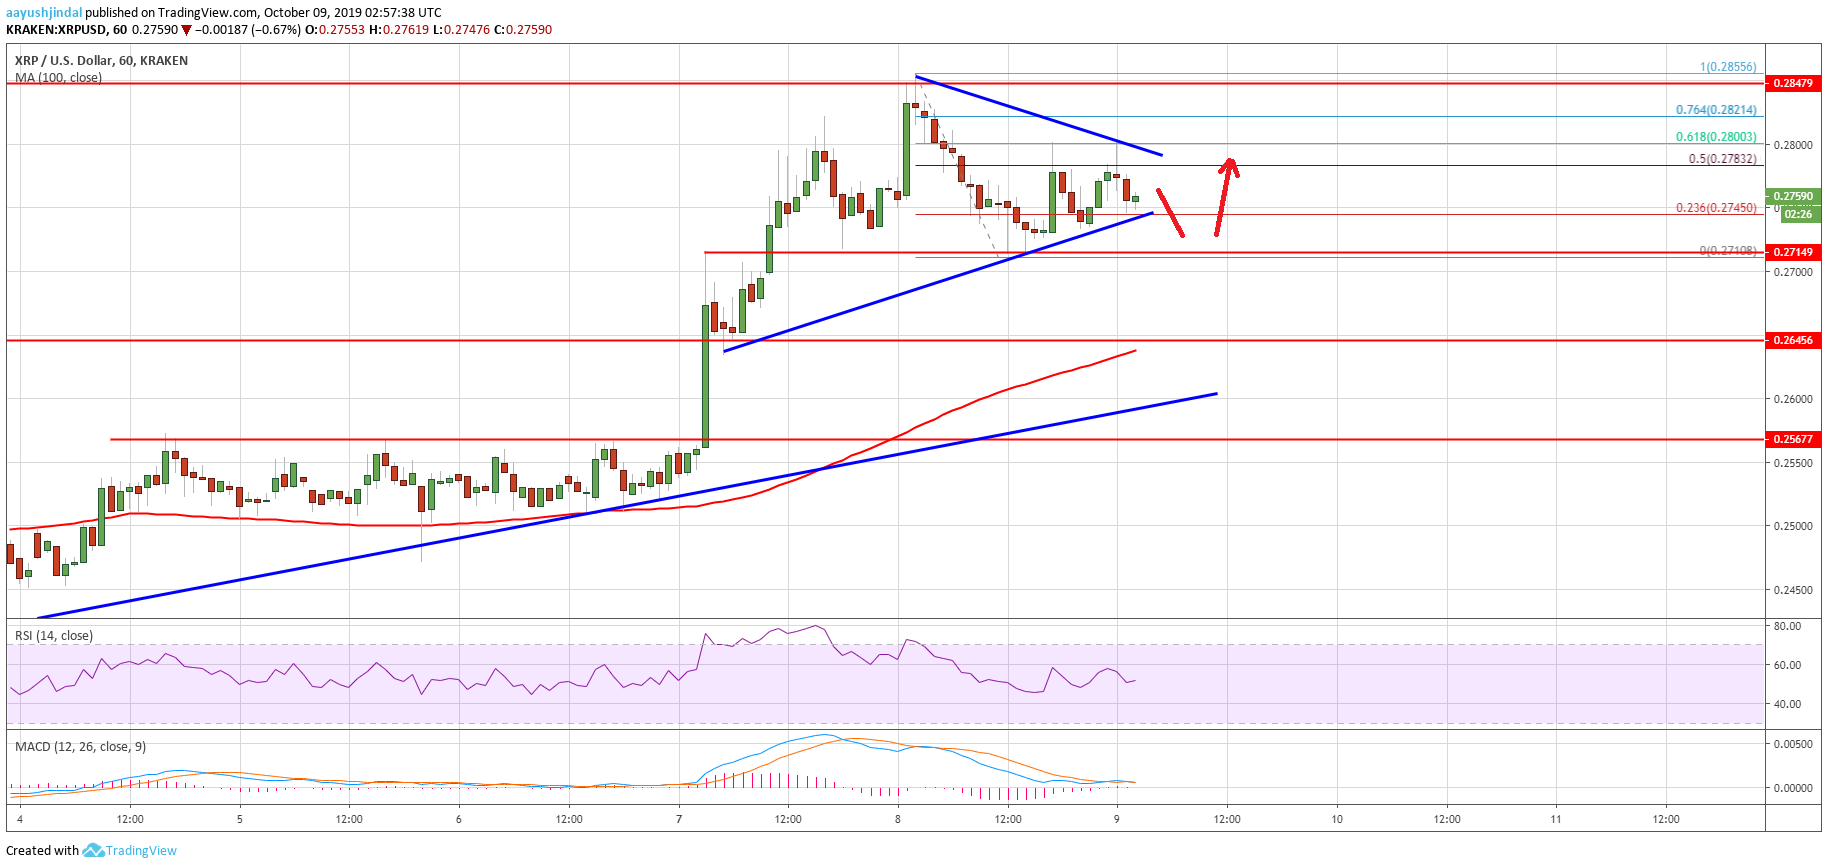
- Ripple price started a downside correction after rallying towards the $0.2850 resistance against the US dollar.
- The price is currently holding the key $0.2720 and $0.2700 support levels.
- There is a short term breakout pattern forming with resistance near $0.2800 on the hourly chart of the XRP/USD pair (data source from Kraken).
- The price might decline towards the $0.2700 support area before it could climb higher.
Ripple price is currently correcting gains against the US Dollar and bitcoin. XRP price might test the $0.2700 support or $0.2650 before it could rise again.
Ripple Price Analysis
Yesterday, there was a strong upward move in ripple price above the $0.2650 resistance against the US Dollar. XRP price even broke the $0.2720 and $0.2750 resistance levels. Moreover, there was a break above the $0.2800 level and the 100 hourly simple moving average. Finally, the price tested the $0.2850 resistance area, where the bears took a stand. A high was formed at $0.2855 and recently the price started a downside correction.
It broke the $0.2800 and $0.2750 support levels. However, the $0.2720 area acted as a decent support. A low was formed near $0.2710 and the price is currently consolidating. It traded above the 50% Fib retracement level of the recent decline from the $0.2855 high to $0.2710 low. However, it seems like the $0.2800 level is now acting as a solid barrier.
Additionally, the 61.8% Fib retracement level of the recent decline from the $0.2855 high to $0.2710 low also acted as a resistance. At the moment, there is a short term breakout pattern forming with resistance near $0.2800 on the hourly chart of the XRP/USD pair. If there is an upside break above $0.2800, ripple price could climb higher towards the key $0.2850 resistance area.
Any further upsides might start another rise and the price could rally towards the $0.2950 and $0.3000 resistance levels. On the downside, the $0.2720 area is a strong support. If there is a break below $0.2720 and $0.2700, the price could extend its downside correction. The next key support is near the $0.2650 level and the 100 hourly simple moving average.
Looking at the chart, ripple price is correcting gains from the $0.2850 resistance. It seems like it could test $0.2700 or even $0.2650 in the near term. Once the current correction is complete, the price could start a fresh rise towards $0.2800, $0.2850 and $0.2950.
Technical Indicators
Hourly MACD – The MACD for XRP/USD is slowly moving into the bullish zone.
Hourly RSI (Relative Strength Index) – The RSI for XRP/USD is currently just above the 50 level.
Major Support Levels – $0.2720, $0.2700 and $0.2650.
Major Resistance Levels – $0.2800, $0.2850 and $0.2920.