Reason to trust
How Our News is Made
Strict editorial policy that focuses on accuracy, relevance, and impartiality
Ad discliamer
Morbi pretium leo et nisl aliquam mollis. Quisque arcu lorem, ultricies quis pellentesque nec, ullamcorper eu odio.
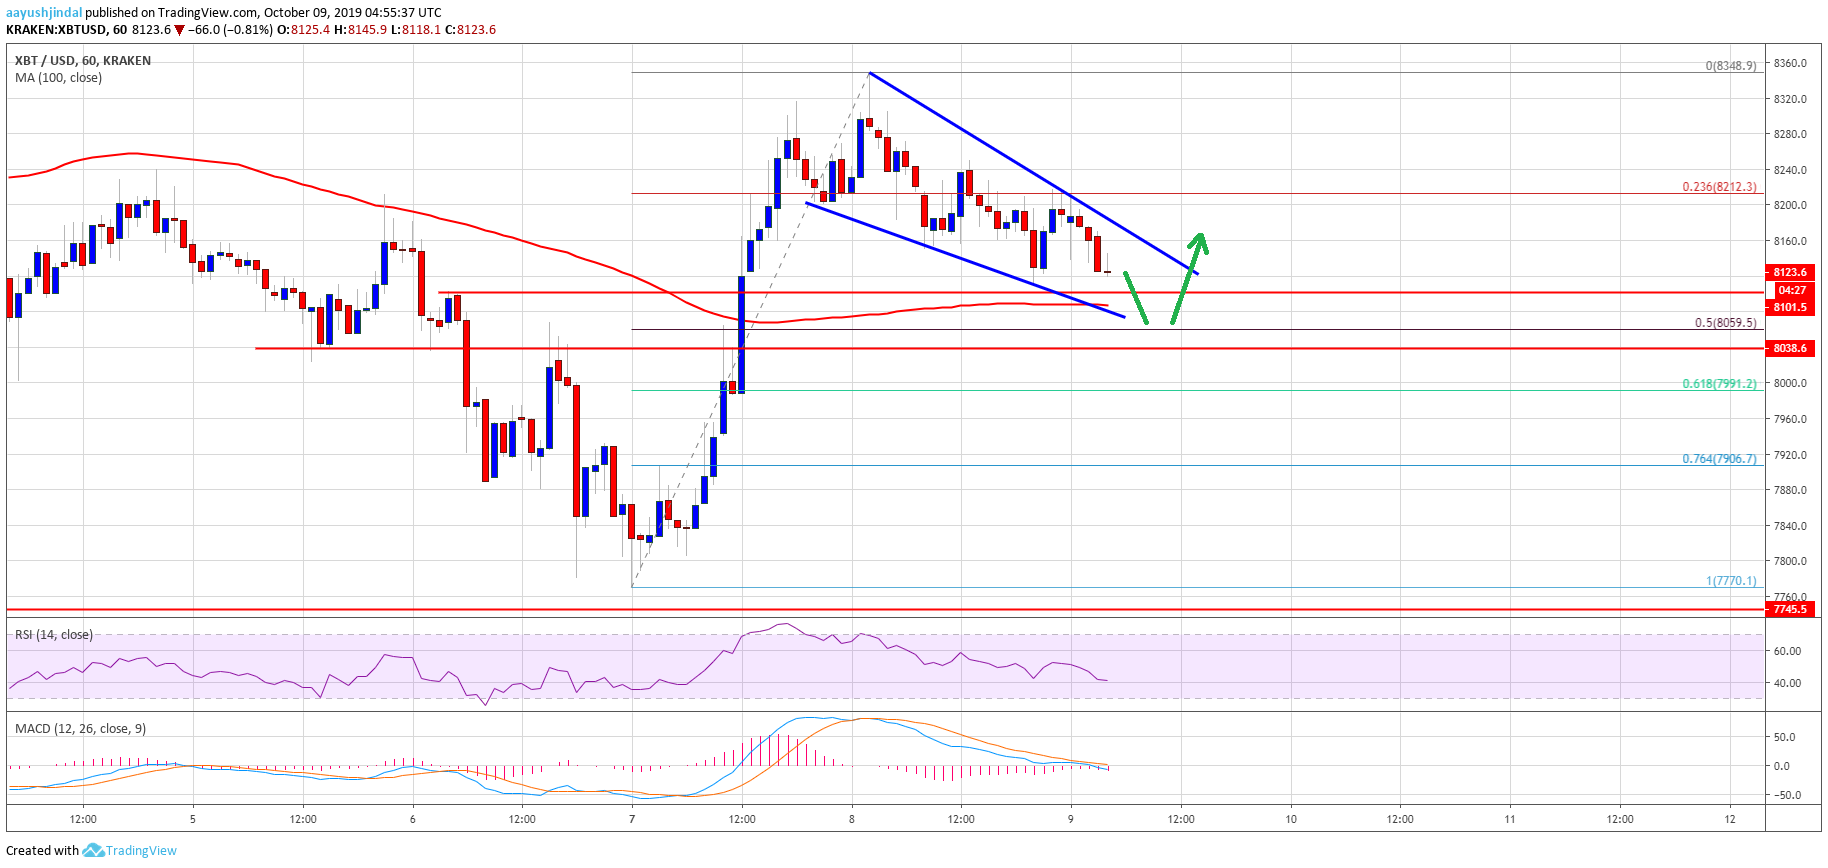
- Bitcoin price formed a high near $8,348 and recently corrected lower against the US Dollar.
- The price is currently trading near the $8,120 level and it could test $8,050 or even $8,000.
- There is a short term contracting triangle forming with resistance near $8,160 on the hourly chart of the BTC/USD pair (data feed from Kraken).
- The price is likely to remain well bid above the $8,050 and $8,000 support levels in the near term.
Bitcoin price is slowly declining below $8,200 against the US Dollar. However, BTC is likely to hold the $8,000 support and it could bounce back above $8,200.
Bitcoin Price Analysis
Yesterday, we saw a nice upward move in BTC above the $8,200 resistance area against the US Dollar. The price even settled above the $8,200 level and the 100 hourly simple moving average. Moreover, the price climbed above the $8,300 level and finally tested the $8,350 area. A high was formed near $8,348 and recently the price started a downside correction.
There was a break below the $8,200 support area. Additionally, the price traded below the 23.6% Fib retracement level of the upward move from the $7,770 low to $8,348 high. On the downside, there are a few key supports near the $8,100, $8,050 and $8,000 levels. An intermediate support is near the $8,080 level and the 100 hourly SMA. Besides, the 50% Fib retracement level of the upward move from the $7,770 low to $8,348 high is near the $8,060 level.
Therefore, dips remain well supported on the downside near the $8,050 level. At the moment, there is a short term contracting triangle forming with resistance near $8,160 on the hourly chart of the BTC/USD pair. If bitcoin breaks the $8,160 resistance, there are chances of a fresh increase above the $8,200 and $8,300 levels. Finally, a clear break above $8,350 might push the price towards the key $8,500 resistance.
On the other hand, a downside break below $8,050 and the 100 hourly SMA might increase bearish pressure. The next key support is near $8,000 or the 61.8% Fib retracement level of the upward move from the $7,770 low to $8,348 high. Should there be a downside break below $8,000, the price could continue to move down.
Looking at the chart, bitcoin is currently correcting lower below the $8,200 level. However, the $8,050 and $8,000 levels are important supports and the price is likely to bounce back in the near term.
Technical indicators:
Hourly MACD – The MACD is likely to move back into the bullish zone.
Hourly RSI (Relative Strength Index) – The RSI for BTC/USD is slowly rising towards the 50 level.
Major Support Levels – $8,050 followed by $8,000.
Major Resistance Levels – $8,160, $8,200 and $8,350.