Reason to trust
How Our News is Made
Strict editorial policy that focuses on accuracy, relevance, and impartiality
Ad discliamer
Morbi pretium leo et nisl aliquam mollis. Quisque arcu lorem, ultricies quis pellentesque nec, ullamcorper eu odio.
- Ripple price remained in a positive zone and rallied another 5% above $0.2750 against the US dollar.
- The price is trading in an uptrend, but it is now facing a strong resistance near $0.2850.
- There is a rising channel forming with support near $0.2780 on the hourly chart of the XRP/USD pair (data source from Kraken).
- The price could correct in the short term, but it might find support near $0.2780 or $0.2750.
Ripple price is up more than 5% against the US Dollar, and it recovered vs bitcoin. XRP price remains well supported on the downside near the $0.2750 level.
Ripple Price Analysis
Yesterday, we saw a nice upward move in ripple price above the $0.2560 resistance against the US Dollar. Later, Ethereum and bitcoin followed and started a nice upward move above $180 and $8,200 respectively. It sparked more gains in XRP/USD above the $0.2750 resistance and the 100 hourly simple moving average. Moreover, the price broke the $0.2800 and $0.2820 resistance levels.
Finally, ripple traded to a new weekly high at $0.2853 and it seems like it could correct higher. The stated $0.2850 area is a major resistance, suggesting a possible downside correction. The price is currently trading below the $0.2820 level. Moreover, it broke the 23.6% Fib retracement level of the recent wave from the $0.2716 low to $0.2853 high.
It seems like there is a rising channel forming with support near $0.2780 on the hourly chart of the XRP/USD pair. The channel support coincides with the 50% Fib retracement level of the recent wave from the $0.2716 low to $0.2853 high. If there is a downside break below the chancel support, ripple price could correct lower towards the $0.2750 support area. Any further losses may perhaps start an extended downside correction towards the key $0.2650 support (the previous resistance).
On the upside, the key resistance area is near the $0.2850 level. If there is a clear break above the $0.2850 resistance, the price could rise another 5% and trade towards the $0.2920 and $0.2950 resistance levels.
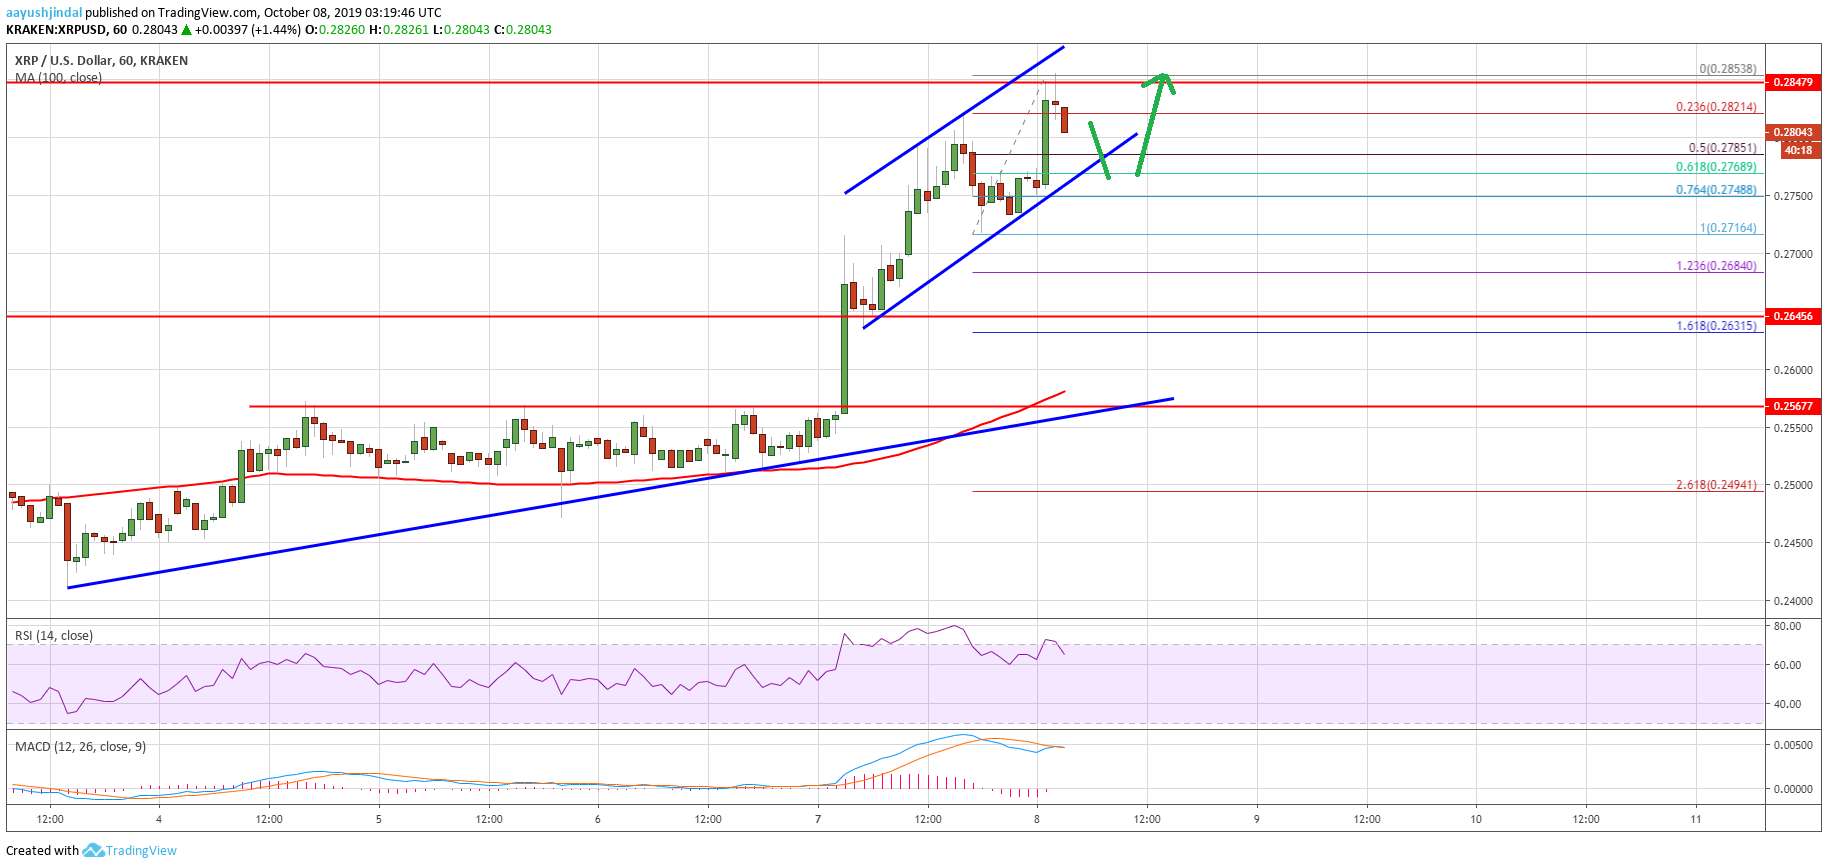
Looking at the chart, ripple price is trading nicely above the $0.2780 and $0.2750 support levels. However, the $0.2850 level is a key barrier for more gains. Therefore, there are chances of a short term downside correction towards $0.2780 or $0.2750. On the upside, a solid rally above $0.2850 could even set the pace for a move towards $0.3000.
Technical Indicators
Hourly MACD – The MACD for XRP/USD is about to move into the bullish zone.
Hourly RSI (Relative Strength Index) – The RSI for XRP/USD is currently correcting lower towards the 60 level.
Major Support Levels – $0.2780, $0.2750 and $0.2720.
Major Resistance Levels – $0.2850, $0.2920 and $0.2950.