
Reason to trust
How Our News is Made
Strict editorial policy that focuses on accuracy, relevance, and impartiality
Ad discliamer
Morbi pretium leo et nisl aliquam mollis. Quisque arcu lorem, ultricies quis pellentesque nec, ullamcorper eu odio.
- Bitcoin price started an upside correction above the $8,000 resistance against the US Dollar.
- The price is currently up around 5% and it recently tested the $8,350 area.
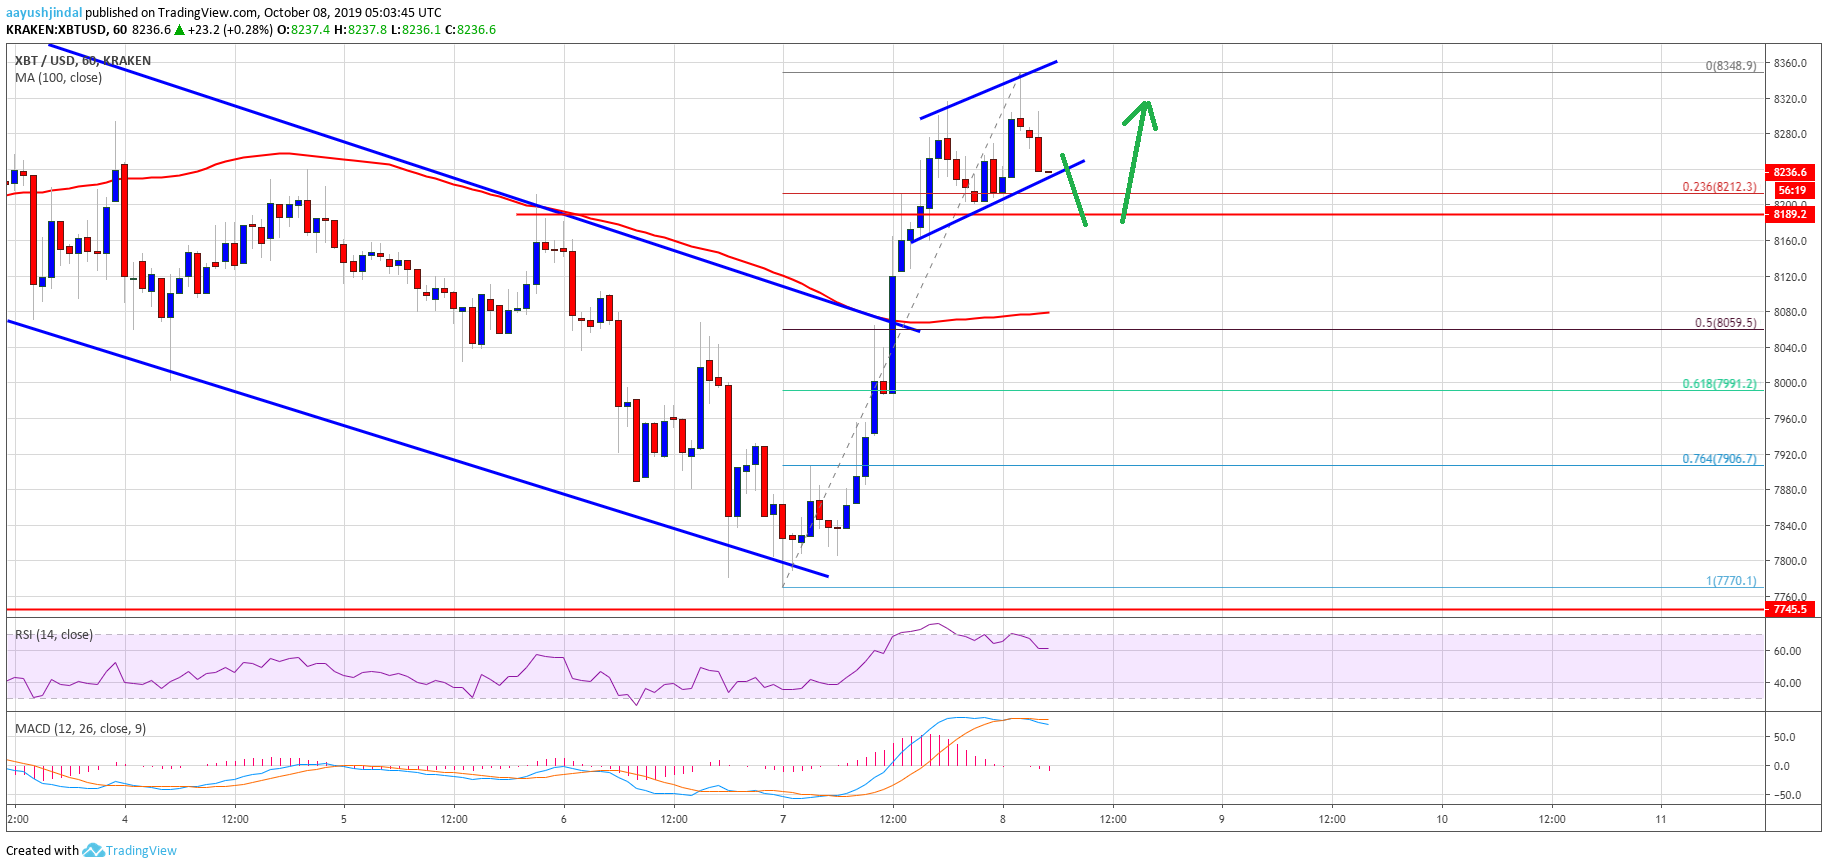
- There was a break above yesterday’s highlighted declining channel with resistance near the $8,060 level on the hourly chart of the BTC/USD pair (data feed from Kraken).
- The price is currently consolidating gains and it could correct lower towards $8,150 or $8,050.
Bitcoin price is currently rebounding above $8,200 against the US Dollar. However, BTC is still facing a lot of hurdles on the upside near $8,400 and $8,500.
Bitcoin Price Analysis
Yesterday, BTC traded to a new weekly low near $7,770 against the US Dollar. Later, the price started an upside correction above the $7,850 and $7,920 resistance levels. Moreover, there was a break above the $8,000 resistance and the 100 hourly simple moving average. During the rise, there was a break above yesterday’s highlighted declining channel with resistance near the $8,060 level on the hourly chart of the BTC/USD pair.
The pair even climbed above the $8,200 resistance and tested the $8,350 level. A swing high was formed near $8,348 and the price is currently correcting gains. It is trading towards the 23.6% Fib retracement level of the recent rebound from the $7,770 low to $8,348 high. It seems like there is a rising channel forming with support near the $8,200 level on the same chart.
If there is a downside break below the channel support, the price could correct lower towards the $8,150 level. The main support on the downside is near the $8,050 level and the 100 hourly simple moving average. Moreover, the 50% Fib retracement level of the recent rebound from the $7,770 low to $8,348 high is close to the $8,060 level to provide support.
Therefore, dips towards the $8,050 level might find support in the near term. Any further declines could push the price towards $8,000 or the 61.8% Fib retracement level of the recent rebound from the $7,770 low to $8,348 high. On the upside, there are many hurdles near $8,350, $8,400 and $8,500. A successful close above the $8,500 resistance is must for the price to move into a positive zone.
Looking at the chart, bitcoin is rebounding from the $7,770 swing low. However, the price is still trading well below the main $8,500 resistance area. In the short term, there could be another dip towards $8,150 or $8,050 before the price climbs above $8,350.
Technical indicators:
Hourly MACD – The MACD is slowly moving into the bearish zone.
Hourly RSI (Relative Strength Index) – The RSI for BTC/USD is now correcting lower towards the 60 level.
Major Support Levels – $8,150 followed by $8,050.
Major Resistance Levels – $8,350, $8,400 and $8,500.


