
Reason to trust
How Our News is Made
Strict editorial policy that focuses on accuracy, relevance, and impartiality
Ad discliamer
Morbi pretium leo et nisl aliquam mollis. Quisque arcu lorem, ultricies quis pellentesque nec, ullamcorper eu odio.
- Bitcoin price is currently declining and is trading well below $8,000 against the US Dollar.
- The price is struggling to recover and it looks set to decline further towards the $7,500 support.
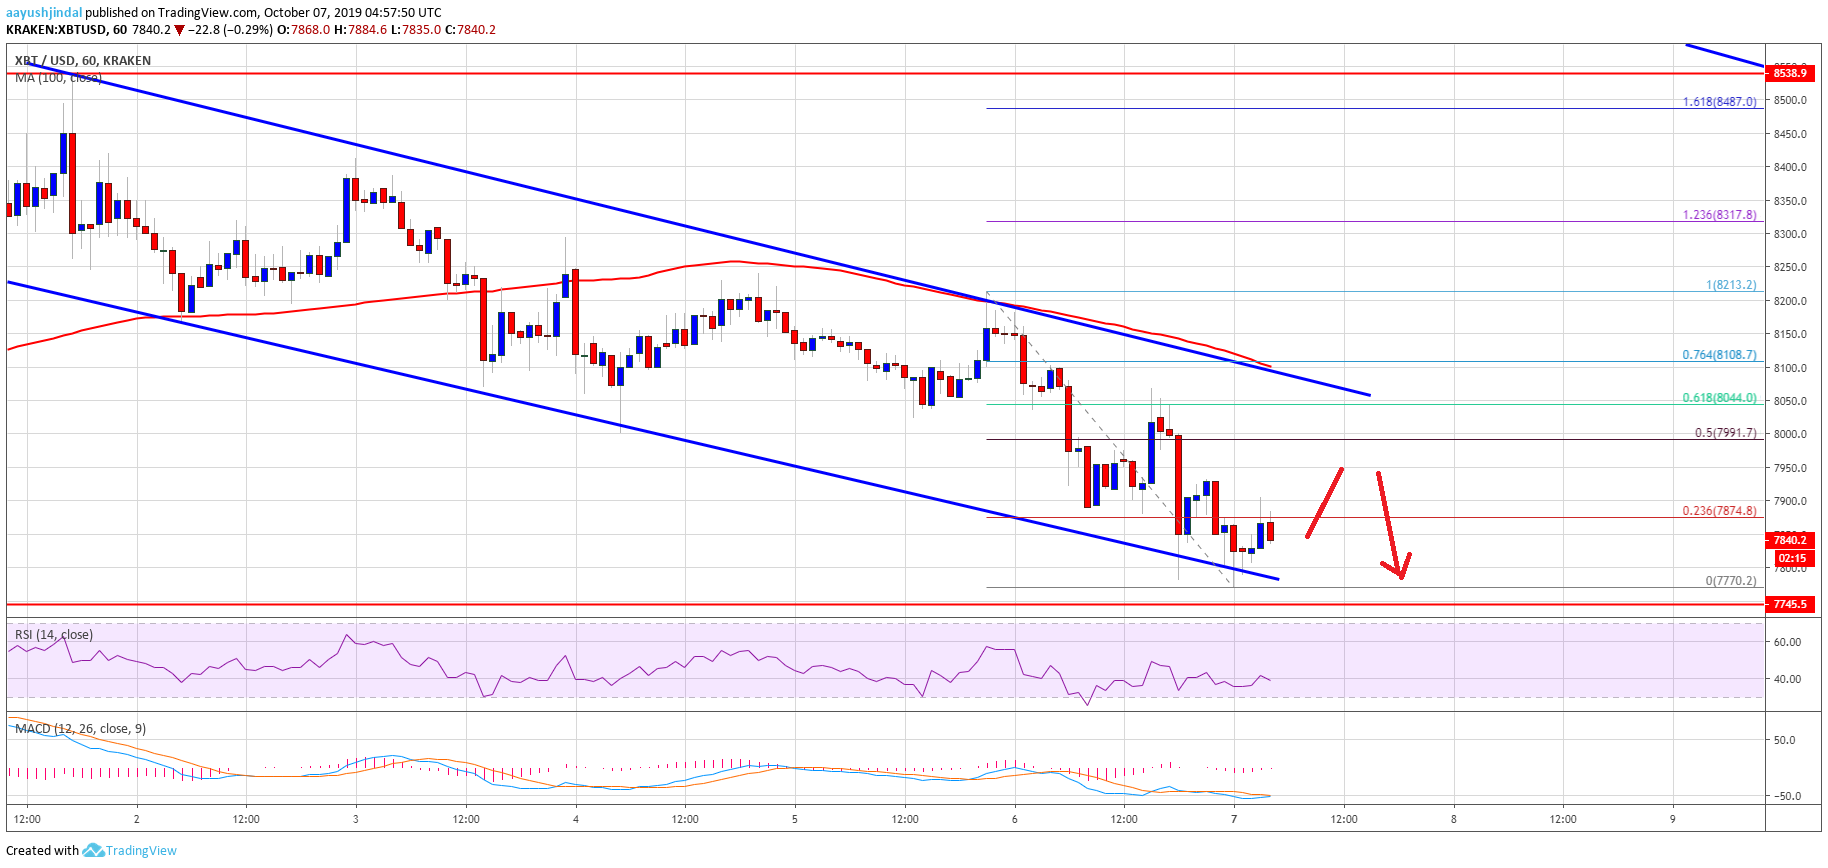
- There is a crucial declining channel forming with resistance near the $8,050 level on the hourly chart of the BTC/USD pair (data feed from Kraken).
- The price is likely to accelerate decline below the $7,800 and $7,750 levels in the near term.
Bitcoin price is showing bearish signs below $8,000 against the US Dollar. BTC remains at a risk of an extended decline towards the $7,500 weekly target.
Bitcoin Price Analysis
In the past few days, there was a steady decline in bitcoin from the $8,500 resistance against the US Dollar. The BTC/USD pair broke many supports near $8,300 and $8,200 to enter a bearish zone. Moreover, there was a close below the $8,200 level and the 100 hourly simple moving average. Recently, the bears gained traction and they were successful in pushing the price below the $8,000 support area.
A new weekly low was formed near $7,770 and the price is currently consolidating losses. An immediate resistance is near the $7,850 level. It coincides with the 23.6% Fib retracement level of the recent decline from the $8,213 high to $7,770 low. On the upside, there are many important hurdles forming for bitcoin near the $8,000 and $8,050 levels. Besides, there is a crucial declining channel forming with resistance near the $8,050 level on the hourly chart of the BTC/USD pair.
An intermediate resistance is near the $7,990 level. It represents the 50% Fib retracement level of the recent decline from the $8,213 high to $7,770 low. Additionally, the channel resistance at $8,050 coincides with the 100 hourly simple moving average. Therefore, if there is an upside correction towards the $8,000 and $8,050 levels, the price could face strong selling interest.
On the downside, an immediate support is near the $7,770 low. If there is a downside break below $7,770 and $7,750, the price could accelerate losses. Besides. the main target for the bears could be $7,500 (as discussed in the past few analyses).
Looking at the chart, bitcoin is currently trading in a downtrend below the $8,000 level and the 100 hourly SMA. Therefore, it seems like the price could extend its decline below the $7,750 and $7,650 levels. On the upside, the bulls are likely to face sellers near $8,000 or $8,050.
Technical indicators:
Hourly MACD – The MACD is currently gaining momentum in the bearish zone.
Hourly RSI (Relative Strength Index) – The RSI for BTC/USD is now well below the 40 level.
Major Support Levels – $7,750 followed by $7,500.
Major Resistance Levels – $7,990, $8,000 and $8,050.