
Reason to trust
How Our News is Made
Strict editorial policy that focuses on accuracy, relevance, and impartiality
Ad discliamer
Morbi pretium leo et nisl aliquam mollis. Quisque arcu lorem, ultricies quis pellentesque nec, ullamcorper eu odio.
- There was a steady decline in bitcoin below the $8,500 support against the US Dollar.
- The price is following a bearish path and it is facing many hurdles near $8,200 and $8,500.
- There is a key declining channel forming with resistance near $8,200 on the 4-hours chart of the BTC/USD pair (data feed from Kraken).
- The price could extend its decline towards the $7,850 support area before it could start a recovery.
Bitcoin price is declining and is trading in a bearish zone below $8,500 against the US Dollar. BTC is likely to decline further to $7,850 or $7,500 before a decent upward move.
Bitcoin Price Weekly Analysis (BTC)
This past week, BTC started a short term recovery from the $7,659 low against the US Dollar. The BTC/USD pair traded above the $7,800 and $8,000 resistance levels. Moreover, there was a break above the $8,200 resistance area. Finally, the price tested the $8,500 resistance area and topped near the $8,539 level. Recently, it started a fresh decline and traded below the $8,400 level.
The price is now following a bearish path below the $8,200 level and is trading well below the 100 simple moving average (4-hours). There was a break below the 50% Fib retracement level of the upward move from the $7,659 low to $8,539 high. At the moment, the price is holding the $8,000 support level, with a bearish angle. An immediate support is near $8,000. It coincides with the 61.8% Fib retracement level of the upward move from the $7,659 low to $8,539 high.
More importantly, there is a key declining channel forming with resistance near $8,200 on the 4-hours chart of the BTC/USD pair. Bitcoin remains at a risk of more downsides below the $8,000 support area. If it breaks $8,000, it could decline towards the $7,850 support area. Any further downsides might trigger a move towards the $7,500 support area in the near term.
On the upside, there are many hurdles near the $8,200 and $8,300 levels. The first major resistance is near the $8,500 level. However, the main resistance is near the $8,600 level and the 100 simple moving average (4-hours). There is also a connecting bearish trend line forming with resistance near $8,600 on the same chart.
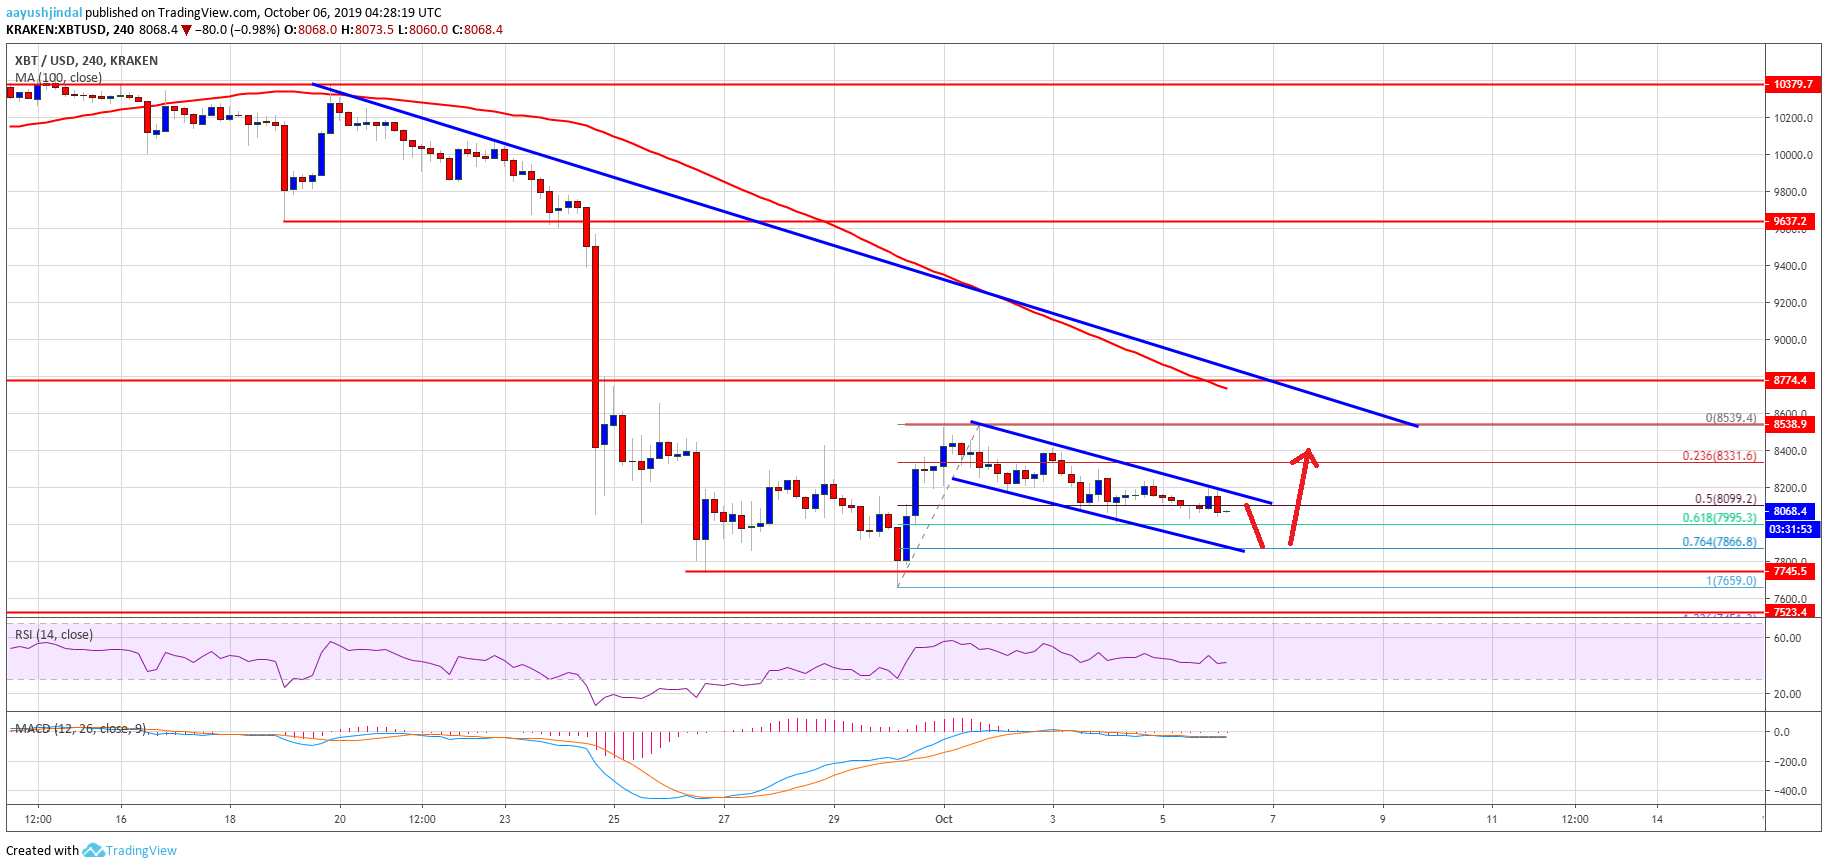
Looking at the chart, bitcoin price is clearly following a bearish path below $8,500. As long as there is no close above $8,500 and $8,600, there is a risk of a sharp decline towards $7,500.
Technical indicators
4 hours MACD – The MACD for BTC/USD is slowly moving into the bearish zone.
4 hours RSI (Relative Strength Index) – The RSI for BTC/USD is now well below the 50 level.
Major Support Level – $7,850
Major Resistance Level – $8,500