
Reason to trust
How Our News is Made
Strict editorial policy that focuses on accuracy, relevance, and impartiality
Ad discliamer
Morbi pretium leo et nisl aliquam mollis. Quisque arcu lorem, ultricies quis pellentesque nec, ullamcorper eu odio.
- ETH price is currently under pressure and is trading below the $175 level against the US Dollar.
- The price is trading above the $170 support area, but it is struggling to climb higher.
- There is a major contracting triangle forming with support near $170 on the hourly chart of ETH/USD (data feed via Kraken).
- A downside break below the $170 support might spark a strong decline towards $165 or $160.
Ethereum price is preparing for the next move versus the US Dollar, while consolidating vs bitcoin. ETH price must stay above the $170 support to avoid another drop.
Ethereum Price Analysis
Yesterday, there was an upward move above the $178 level in Ethereum against the US Dollar. ETH price even traded above the $180 resistance and the 100 hourly simple moving average. However, the bulls failed to push the price further higher and it remained well below the $185 resistance. A swing high was formed near the $182 level and the price recently declined below $180 and $178.
Moreover, there was a break below the $175 support area and the 100 hourly SMA. The decline was such that the price even broke the $172 support. Finally, it tested the $170 support area. The bears made two attempts to push the price below the $170 support, but they failed to gain strength. As a result, there was an upside correction above the $172 level.
The price broke the 23.6% Fib retracement level of the recent drop from the $182 high to $170 low. However, the previous support near the $175 level and the 100 hourly SMA is currently acting as a resistance. Additionally, the 50% Fib retracement level of the recent drop from the $182 high to $170 low is also acting as a solid resistance. More importantly, there is a major contracting triangle forming with support near $170 on the hourly chart of ETH/USD.
If there is a downside break below the $170 support, the price could continue to decline. The next key support is near $165, below which the price is likely to test $160. Conversely, an upside break above $182 and $185 is needed for bullish acceleration.
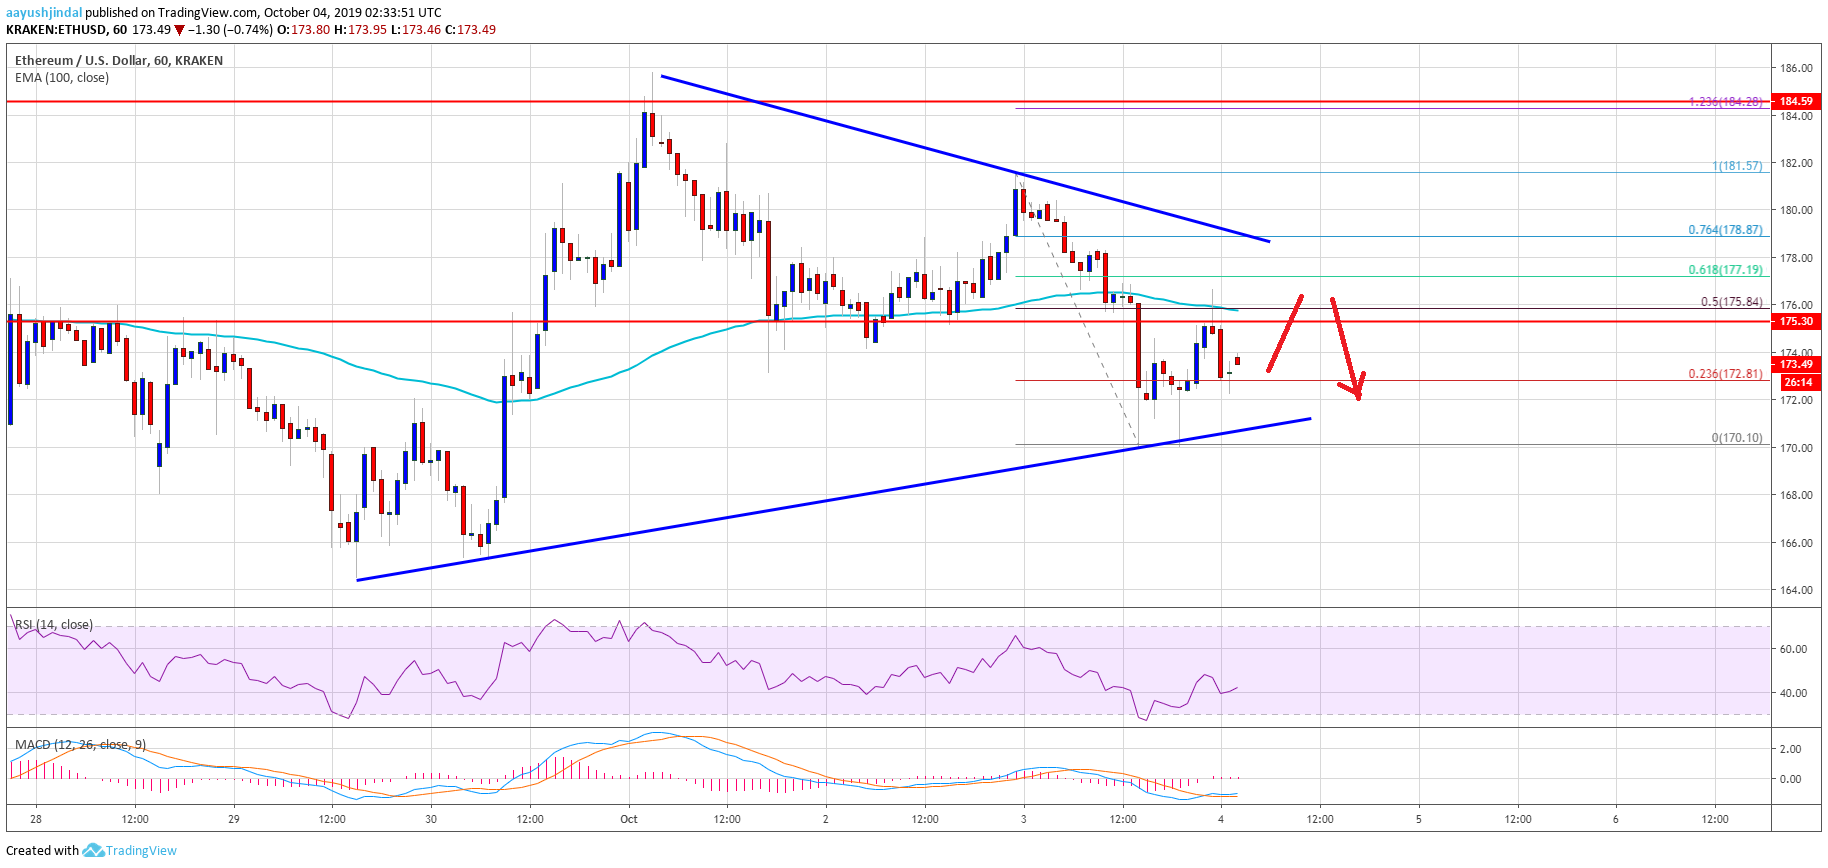
Looking at the chart, Ethereum price is clearly preparing for the next move either above $185 or below $170. As long as the price is below the $175 pivot level and the 100 hourly SMA, there is a risk of a downside break.
ETH Technical Indicators
Hourly MACD – The MACD for ETH/USD is slowly moving into the bullish zone.
Hourly RSI – The RSI for ETH/USD is currently just above the 40 level, with a positive angle.
Major Support Level – $170
Major Resistance Level – $182


