
Reason to trust
How Our News is Made
Strict editorial policy that focuses on accuracy, relevance, and impartiality
Ad discliamer
Morbi pretium leo et nisl aliquam mollis. Quisque arcu lorem, ultricies quis pellentesque nec, ullamcorper eu odio.
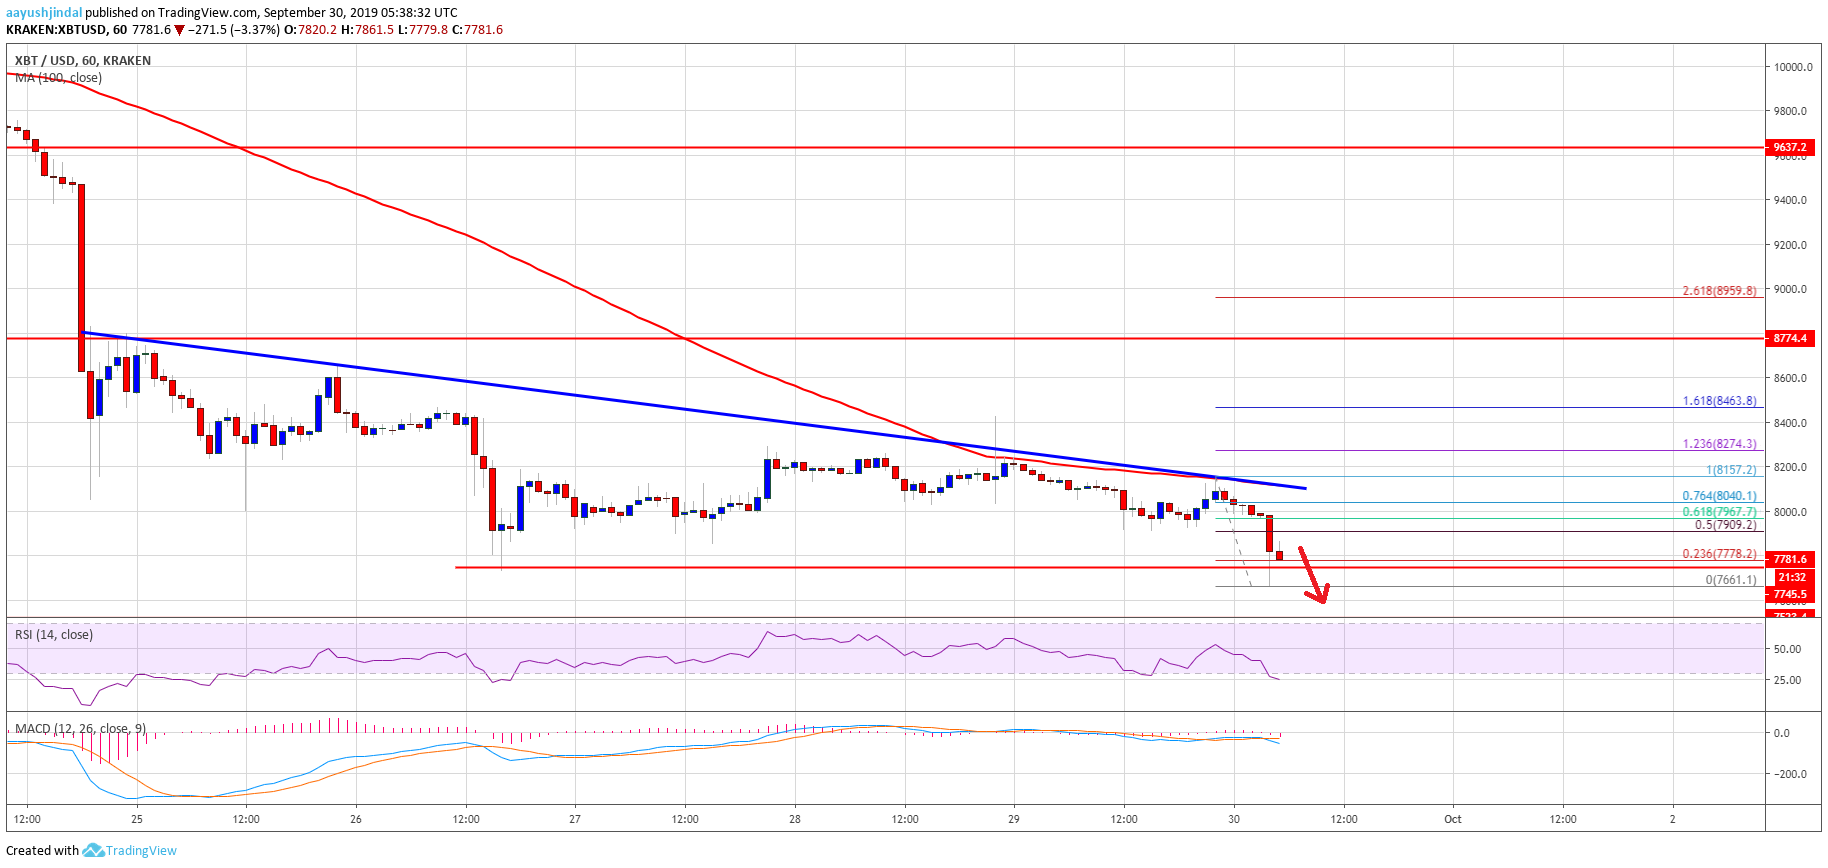
- Bitcoin price is declining and it recently traded to a new monthly low at $7,661 against the US Dollar.
- The price is trading in a downtrend and it is likely to test the $7,500 or $7,200 level in the near term.
- There is a key bearish trend line forming with resistance near $8,050 on the hourly chart of the BTC/USD pair (data feed from Kraken).
- The price could soon complete the current decline near $7,500 or $7,200 in the coming sessions.
Bitcoin price is showing signs of more downsides below $8,000 against the US Dollar. BTC is likely to find a strong buying interest near the $7,500 or $7,200 support.
Bitcoin Price Analysis
Recently, there was a minor upside correction in bitcoin above the $8,000 level against the US Dollar. The BTC/USD pair even climbed above the $8,200 resistance. Finally, the price spiked towards $8,400, but it failed to gain momentum. Moreover, there was no proper close above $8,200 and the 100 hourly simple moving average. As a result, the price started a fresh decline below the $8,000 support.
It even broke the $7,700 level and traded to a new monthly low at $7,661. Besides, the current price action is bearish, with an immediate resistance near the $7,900 level. Additionally, 50% Fib retracement level of the recent decline from the $8,157 high to $7,661 low is also near the $7,900 level. The main resistance on the upside is near the $8,000 and $8,100 levels. More importantly, there is a key bearish trend line forming with resistance near $8,050 on the hourly chart of the BTC/USD pair.
An intermediate resistance is near the $8,040 level, plus the 76.4% Fib retracement level of the recent decline from the $8,157 high to $7,661 low. Therefore, an upside break above the $8,000 and $8,100 levels is must for a decent recovery in bitcoin. The next key resistance is near the $8,400 level.
If the price fails to recover above the $8,000 and $8,100 resistance levels, it could continue to decline. An immediate support is near the $7,600 level, below which the price is likely to test the main weekly bearish target of $7,500. Moreover, if there are more downsides, the price may perhaps test the $7,200 support area.
Looking at the chart, bitcoin is clearly declining and is struggling below the $8,000 level. Therefore, there is a risk of more downsides towards $7,500 and $7,200. Having said that, the bears need to be careful since there could be a strong bounce once the current wave is complete.
Technical indicators:
Hourly MACD – The MACD is gaining pace in the bearish zone.
Hourly RSI (Relative Strength Index) – The RSI for BTC/USD is currently well below the 30 level.
Major Support Levels – $7,500 followed by $7,200.
Major Resistance Levels – $8,000, $8,100 and $8,400.