Reason to trust
How Our News is Made
Strict editorial policy that focuses on accuracy, relevance, and impartiality
Ad discliamer
Morbi pretium leo et nisl aliquam mollis. Quisque arcu lorem, ultricies quis pellentesque nec, ullamcorper eu odio.
- Ripple price declined sharply after it broke the $0.2650 and $0.2500 supports against the US dollar.
- The price is down more than 10% and it recently traded close to the $0.2050 level.
- Yesterday’s highlighted declining channel was breached with support near $0.2620 on the hourly chart of the XRP/USD pair (data source from Kraken).
- The price is currently correcting higher, but it is facing hurdles near $0.2450 and $0.2550.
Ripple price is currently rebounding after a sharp decline against the US Dollar, similar to bitcoin and Ethereum. XRP price is likely to face resistance near $0.2450 and $0.2550.
Ripple Price Analysis
In the past two analysis, we discussed the importance of the $0.2650 support for ripple price against the US Dollar. The XRP/USD pair failed to hold the $0.2650 support, resulting in a sharp decline. The pair declined more than 15% and broke many supports, including $0.2550, $0.2500, $0.2400 and $0.2200. Moreover, there was a close below the $0.2500 level and the 100 hourly simple moving average.
Additionally, yesterday’s highlighted declining channel was breached with support near $0.2620 on the hourly chart of the XRP/USD pair. Finally, the price traded close to the $0.2050 level and formed a new monthly low at $0.2064. It is currently correcting higher above the $0.2100 and $0.2200 levels. Moreover, there was a break above the 23.6% Fib retracement level of the recent slide from the $0.2729 high to $0.2064 low.
At the moment, the price is trading near the $0.2400 level. The 50% Fib retracement level of the recent slide from the $0.2729 high to $0.2064 low is also near $0.2400. On the upside, an immediate resistance is near the $0.2450 level. If there is an upside break above $0.2450, the price could recover towards the $0.2550 resistance area. Any further gains might push the price back into a positive zone above $0.2650.
Conversely, if the price fails to continue above $0.2450 or $0.2550, it is likely to resume its downward move. An immediate support is near the $0.2350 level, below which the price might test the $0.2200 support area. If the price fails to stay above $0.2200, it is likely to test the $0.2000 support area in the near term.
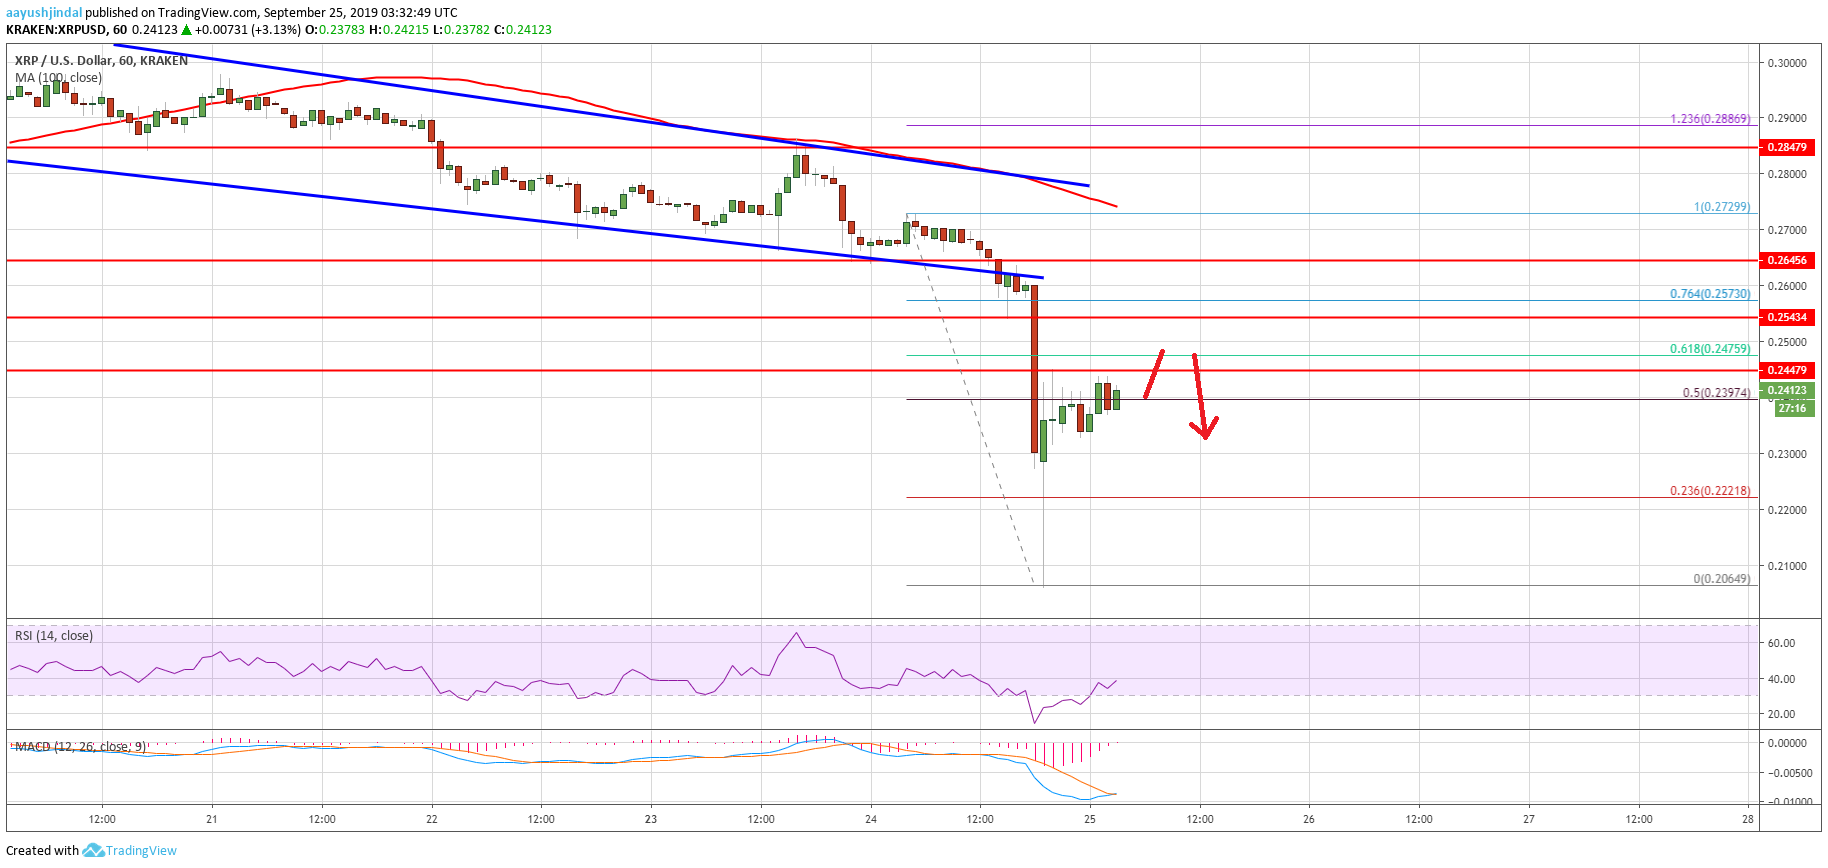
Looking at the chart, ripple price is clearly rebounding nicely above $0.2350. Having said that, the price must move back above $0.2450 and $0.2550 to decrease the bearish pressure and start a fresh increase.
Technical Indicators
Hourly MACD – The MACD for XRP/USD is likely moving back into the bullish zone.
Hourly RSI (Relative Strength Index) – The RSI for XRP/USD is currently correcting higher towards the 40 level.
Major Support Levels – $0.2350, $0.2200 and $0.2120.
Major Resistance Levels – $0.2450, $0.2550 and $0.0.2650.