
Reason to trust
How Our News is Made
Strict editorial policy that focuses on accuracy, relevance, and impartiality
Ad discliamer
Morbi pretium leo et nisl aliquam mollis. Quisque arcu lorem, ultricies quis pellentesque nec, ullamcorper eu odio.
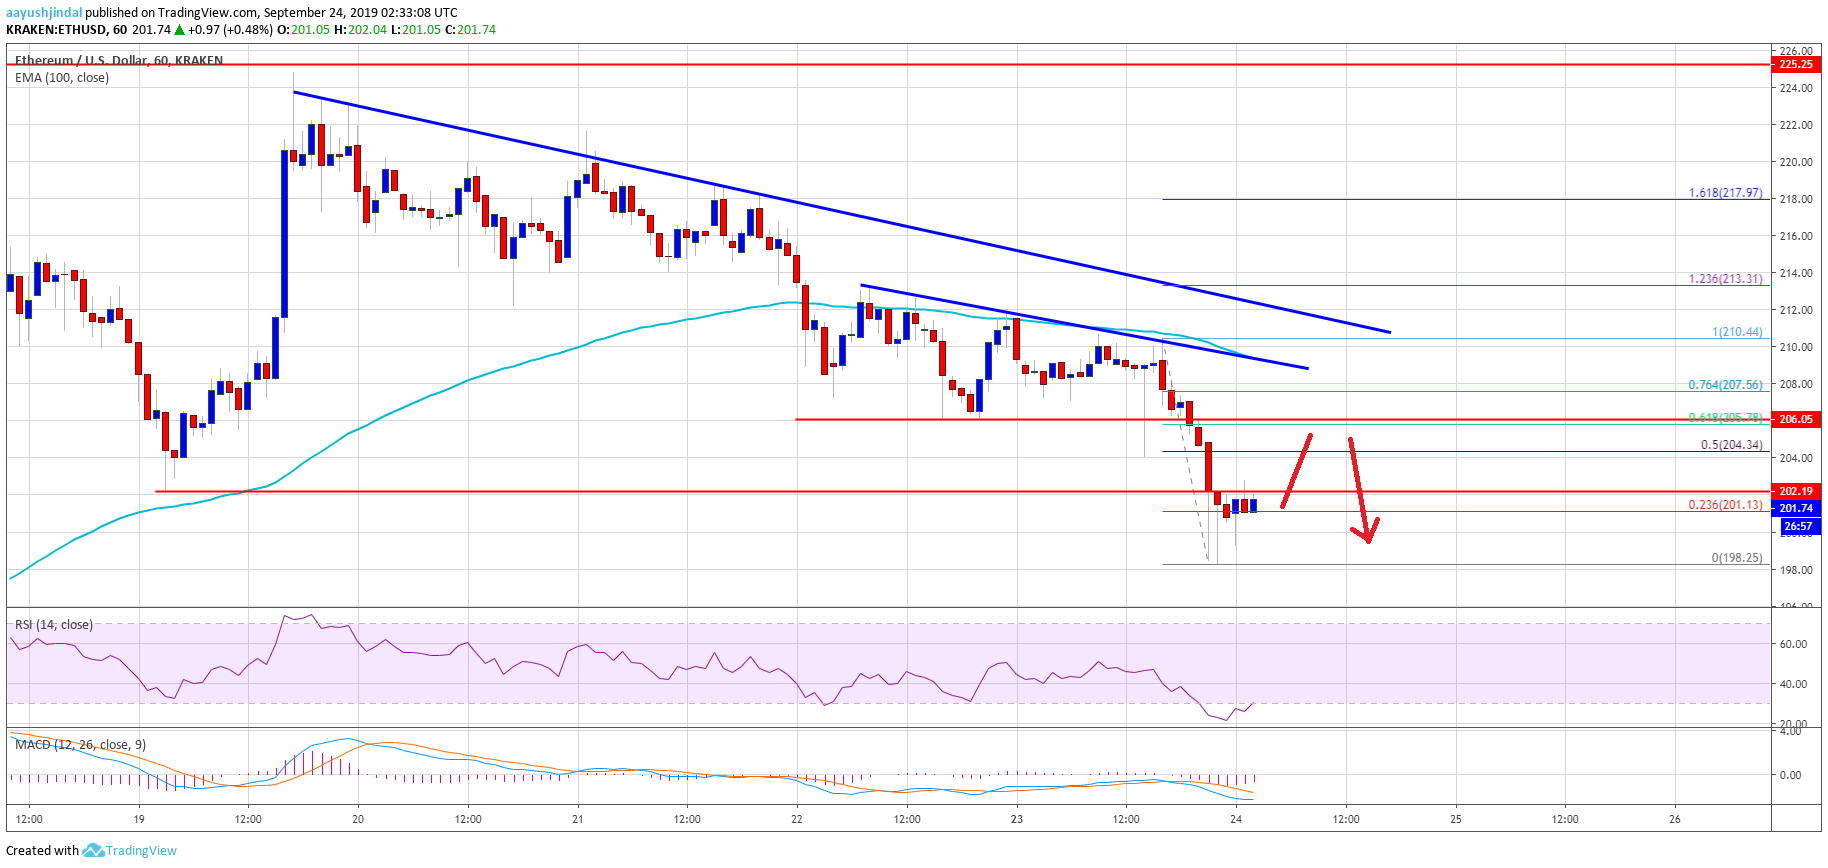
- ETH price is under a lot of pressure and it recently broke the $202 support against the US Dollar.
- The price is likely to continue lower towards the $195 and $192 support levels in the near term.
- There are two major bearish trend lines forming with resistance near $208 and $210 on the hourly chart of ETH/USD (data feed via Kraken).
- The pair could correct higher, but upsides are likely to be capped near the $210 level.
Ethereum price is extending its decline versus the US Dollar and bitcoin. ETH price could continue to decline and it might soon test the $192 support.
Ethereum Price Analysis
After a failed attempt near $215, ETH price started a downward move against the US Dollar. The price traded below the $212 and $210 support levels. Moreover, it settled below the $210 level and the 100 hourly simple moving average. More importantly, the price broke the $202 and $200 support levels. A new weekly low was formed near $198 and the price is currently consolidating losses.
It is testing the 23.6% Fib retracement level of the latest drop from the $210 high to $198 low. It seems like the previous support near $202 is acting as a resistance. On the upside, there are many key resistances near the $205, $208 and $210 levels. Moreover, there are two major bearish trend lines forming with resistance near $208 and $210 on the hourly chart of ETH/USD.
The 50% Fib retracement level of the latest drop from the $210 high to $198 low is near $205 to act as a solid resistance. The main resistance is near the first trend line, the 100 hourly SMA, and $208. If there is an upside break above $208 and $210, Ethereum price will most likely move back into a positive zone. The next key resistance is near the $220 level, above which it could retest $225.
Conversely, if the price fails to surpass the $208 and $210 resistance levels, it might continue to decline. An immediate support is near the $198 low. If there is a downside break below $198, the price is likely to test the $195 and $192 support levels.
Looking at the chart, Ethereum price is clearly declining and is trading below a few key resistances such as $208 and $210. As long as the price is trading below the $210 support, there are chances of a downside extension towards the $192 level.
ETH Technical Indicators
Hourly MACD – The MACD for ETH/USD is currently placed heavily in the bearish zone.
Hourly RSI – The RSI for ETH/USD is currently correcting higher from the 20 level.
Major Support Level – $192
Major Resistance Level – $210


