
Reason to trust
How Our News is Made
Strict editorial policy that focuses on accuracy, relevance, and impartiality
Ad discliamer
Morbi pretium leo et nisl aliquam mollis. Quisque arcu lorem, ultricies quis pellentesque nec, ullamcorper eu odio.
- Ripple price is currently declining and is trading below the $0.2850 support against the US dollar.
- The price is likely to face resistance near $0.2850 and $0.2920 in the near term.
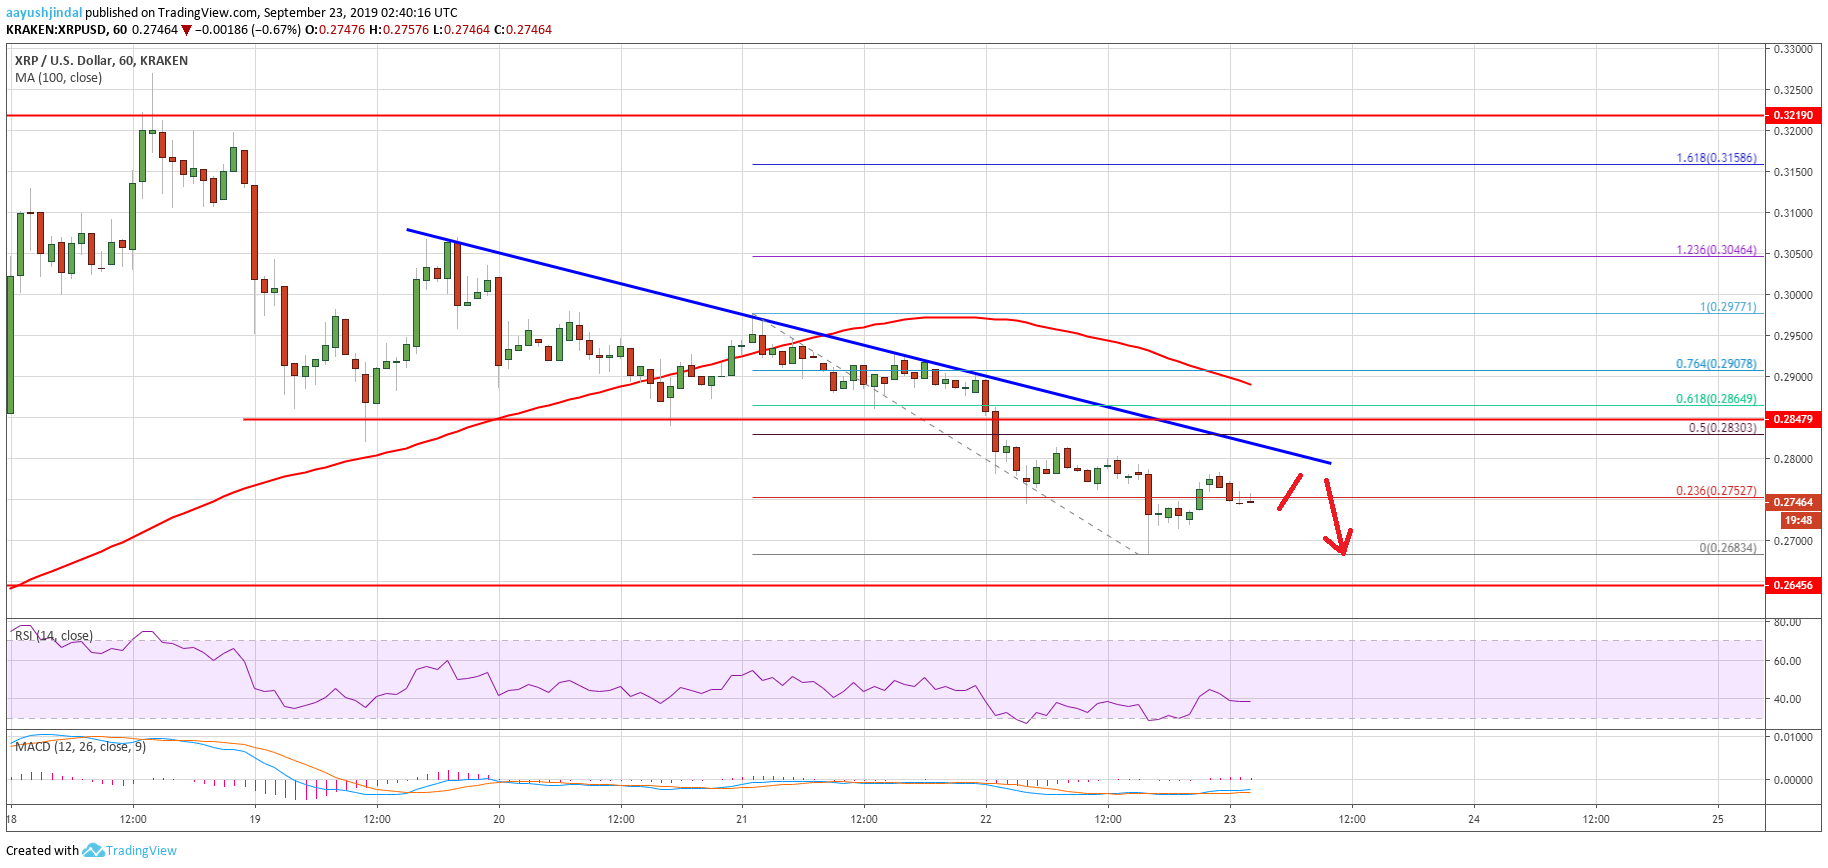
- There is a major bearish trend line forming with resistance near $0.2820 on the hourly chart of the XRP/USD pair (data source from Kraken).
- The price is under pressure, but it approaching a crucial support area near the $0.2650 level.
Ripple price is currently declining against the US Dollar, along with bitcoin and Ethereum. XRP price is likely to test the key $0.2650 support before it could recover.
Ripple Price Analysis
In the past few sessions, ripple price declined steadily from the $0.3050 resistance against the US Dollar. The XRP/USD pair traded below the $0.2920 and $0.2850 support levels. Moreover, there was a close below the $0.2850 support and the 100 hourly simple moving average. It opened the doors for more downsides and the price traded to a new weekly low at $0.2683.
At the moment, the price is currently correcting higher towards the $0.2800 level. It is trading near the 23.6% Fib retracement level of the last decline from the $0.2977 high to $0.2683 low. On the upside, there are many hurdles near the $0.2820 and $0.2850 levels. Moreover, there is a major bearish trend line forming with resistance near $0.2820 on the hourly chart of the XRP/USD pair.
The trend line is just below the 50% Fib retracement level of the last decline from the $0.2977 high to $0.2683 low. If there is an upside break above the trend line, the price could face resistance near the $0.2850 level. The next key resistance is near the $0.2920 area and the 100 hourly SMA. To move back into a positive zone, the price must climb above the $0.2920 resistance.
Conversely, if there are more downsides, the price could break the $0.2983 low. The main support is near the $0.2650 level (the last week’s breakout level). If the price fails to stay above the $0.2650 level, there are chances of a sharp decline in ripple in the coming sessions.
Looking at the chart, ripple price is clearly under pressure below the $0.2850 and $0.2920 levels. It seems like the price could trade in a range in the near term below $0.2850. However, it must stay above the $0.2650 support area to start a solid recovery in the near term.
Technical Indicators
Hourly MACD – The MACD for XRP/USD is slowly moving into the bullish zone.
Hourly RSI (Relative Strength Index) – The RSI for XRP/USD is currently well below the 50 level.
Major Support Levels – $0.2680, $0.2650 and $0.2500.
Major Resistance Levels – $0.2820, $0.2850 and $0.0.2920.


