
Reason to trust
How Our News is Made
Strict editorial policy that focuses on accuracy, relevance, and impartiality
Ad discliamer
Morbi pretium leo et nisl aliquam mollis. Quisque arcu lorem, ultricies quis pellentesque nec, ullamcorper eu odio.
- ETH price surged higher above the $200 and $210 resistance levels against the US Dollar.
- The price is currently correcting lower after posting a new monthly high near $225.
- There was a break below a major bullish trend line with support near $216 on the 4-hours chart of ETH/USD (data feed via Kraken).
- The pair is currently declining, but it is likely to find strong bids near $202 and $200.
Ethereum price is correcting gains from $225 against the US Dollar, while bitcoin is declining. ETH might revisit the $200 support area before it could start a fresh increase.
Ethereum Price Weekly Analysis
This past week, there was a solid upward move in ETH above the $185 and $200 resistance levels against the US Dollar. Moreover, there was a close above the $200 level and the 100 simple moving average (4-hours). It opened the doors for more gains and Ether climbed above the $210 and $215 resistance levels. Finally, there was a new monthly high was formed near $225 before the price started a downside correction.
On the other hand, bitcoin price struggled to break the $10,400 resistance area and it is currently under pressure. Ethereum is also declining and it recently broke the $215 support area. Additionally, there was a break below the 50% Fib retracement level of the last major upward move from the $202 low to $225 high. More importantly, there was a break below a major bullish trend line with support near $216 on the 4-hours chart of ETH/USD.
The pair is now trading well below the $210 level. An immediate support is near the $208 level. It coincides with the 76.4% Fib retracement level of the last major upward move from the $202 low to $225 high. However, the main support on the downside for Ethereum is near the $202 and $200 levels. If there is a downside break below the $202 level, the price could continue to decline towards the $185 support.
On the upside, an immediate resistance is near the $215 level. If there is an upside break above the $215 level, the price could revisit the $225 high. Any further gains might push the price towards the $240 level.
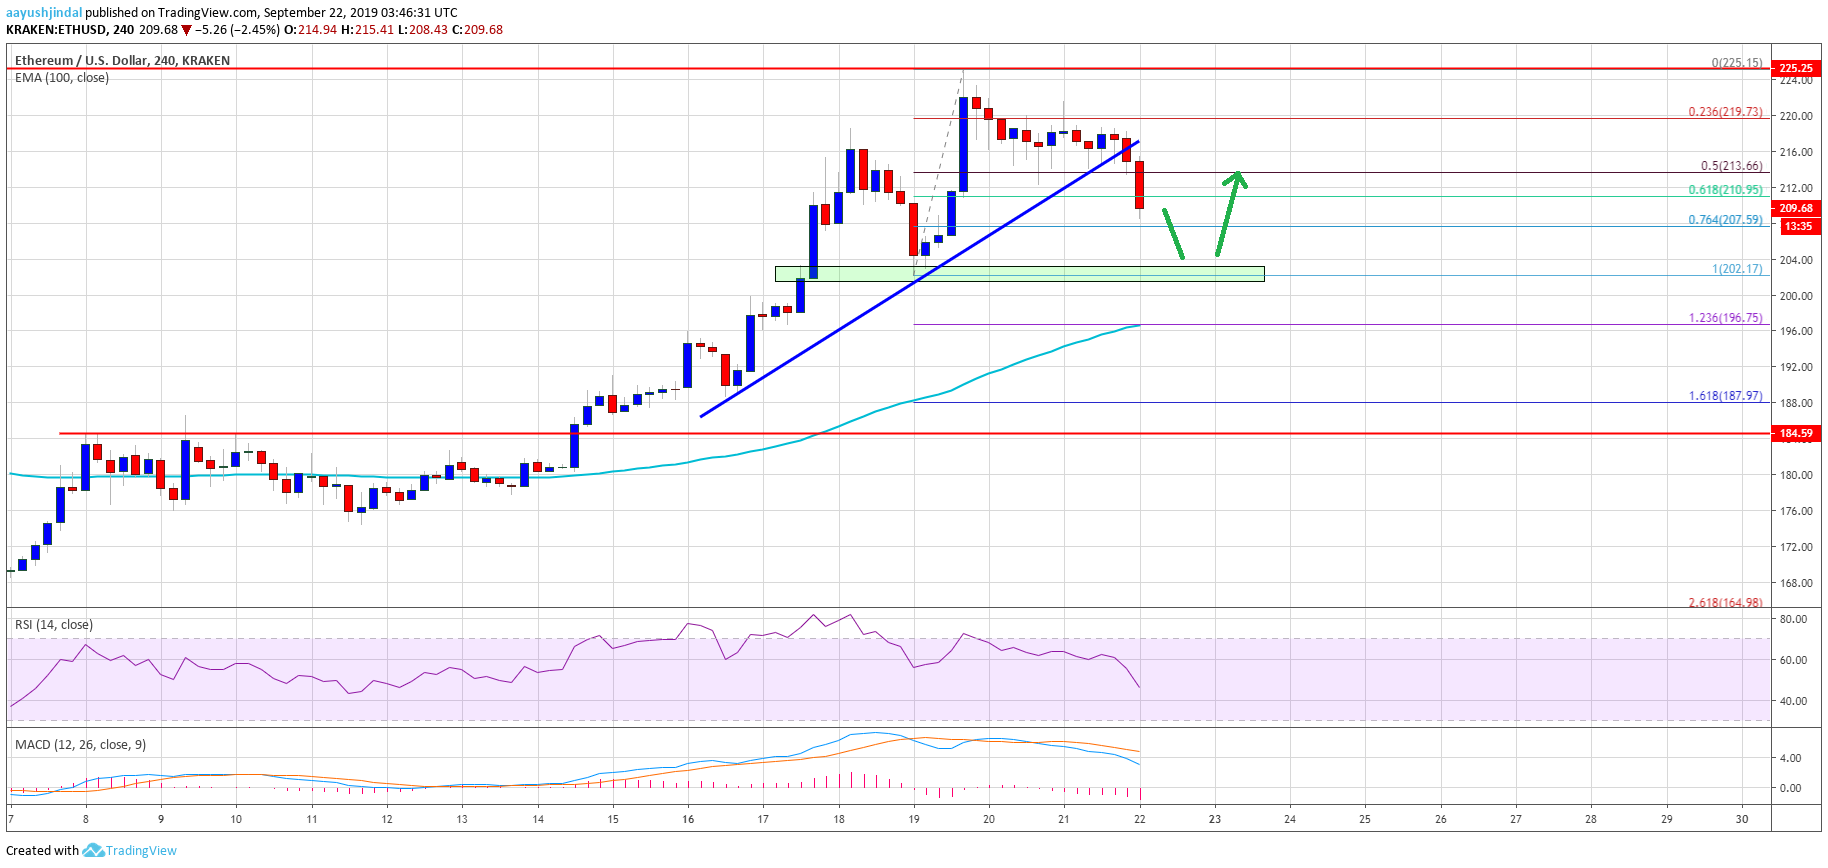
The above chart indicates that Ethereum price is currently correcting gains from the $225 high. However it is likely to find strong bids near $202 and $200. Once the current correction is complete near $200, the price could bounce back.
Technical Indicators
4 hours MACD – The MACD for ETH/USD is slowly gaining momentum in the bearish zone.
4 hours RSI – The RSI for ETH/USD is currently declining and is below the 50 level.
Major Support Level – $202
Major Resistance Level – $215


