
Reason to trust
How Our News is Made
Strict editorial policy that focuses on accuracy, relevance, and impartiality
Ad discliamer
Morbi pretium leo et nisl aliquam mollis. Quisque arcu lorem, ultricies quis pellentesque nec, ullamcorper eu odio.
- Bitcoin price is trading in a range below the $10,300 and $10,400 resistances against the US Dollar.
- The price is struggling to gain momentum above $10,300 and the 100 hourly SMA.
- There is a key breakout pattern forming with support near $10,200 on the hourly chart of the BTC/USD pair (data feed from Kraken).
- The price could either rally above $10,400 or it might extend its decline towards the $9,900 support.
Bitcoin price is trading below key resistances and hurdles against the US Dollar. BTC is likely to make the next move either above $10,400 or towards $9,900.
Bitcoin Price Analysis
In the past three days, bitcoin price declined steadily below $10,400 against the US Dollar. On the other hand, Ethereum rallied above $200 and ripple price surged above the $0.3000 resistance. BTC/USD is now trading well below the $10,300 level and the 100 hourly simple moving average. The last swing high was formed near $10,348 and the recent low was near $10,138.
At the moment, the price is consolidating gains above $10,200. It broke the $10,240 resistance, plus the 50% Fib retracement level of the recent decline from the $10,348 high to $10,138 low. However, the upward move was capped by the $10,270 level. It seems like the 61.8% Fib retracement level of the recent decline from the $10,348 high to $10,138 low is capping the upward move.
More importantly, there is a key breakout pattern forming with support near $10,200 on the hourly chart of the BTC/USD pair. There are many hurdles on the upside near $10,270, $10,300, and the 100 hourly SMA. If there is an upside break above the $10,300 level and the 100 hourly SMA, the price could continue higher. The next key resistances are near the $10,400 and $10,440 levels.
Conversely, if the price continues to struggle below $10,300, there could be a downside break. An immediate support is near the $10,200 level. A convincing break and follow through below $10,200 will most likely push the price towards the $10,000 support. The main support is near the $9,900, below which there could be a nasty drop towards $9,500 or $9,200.
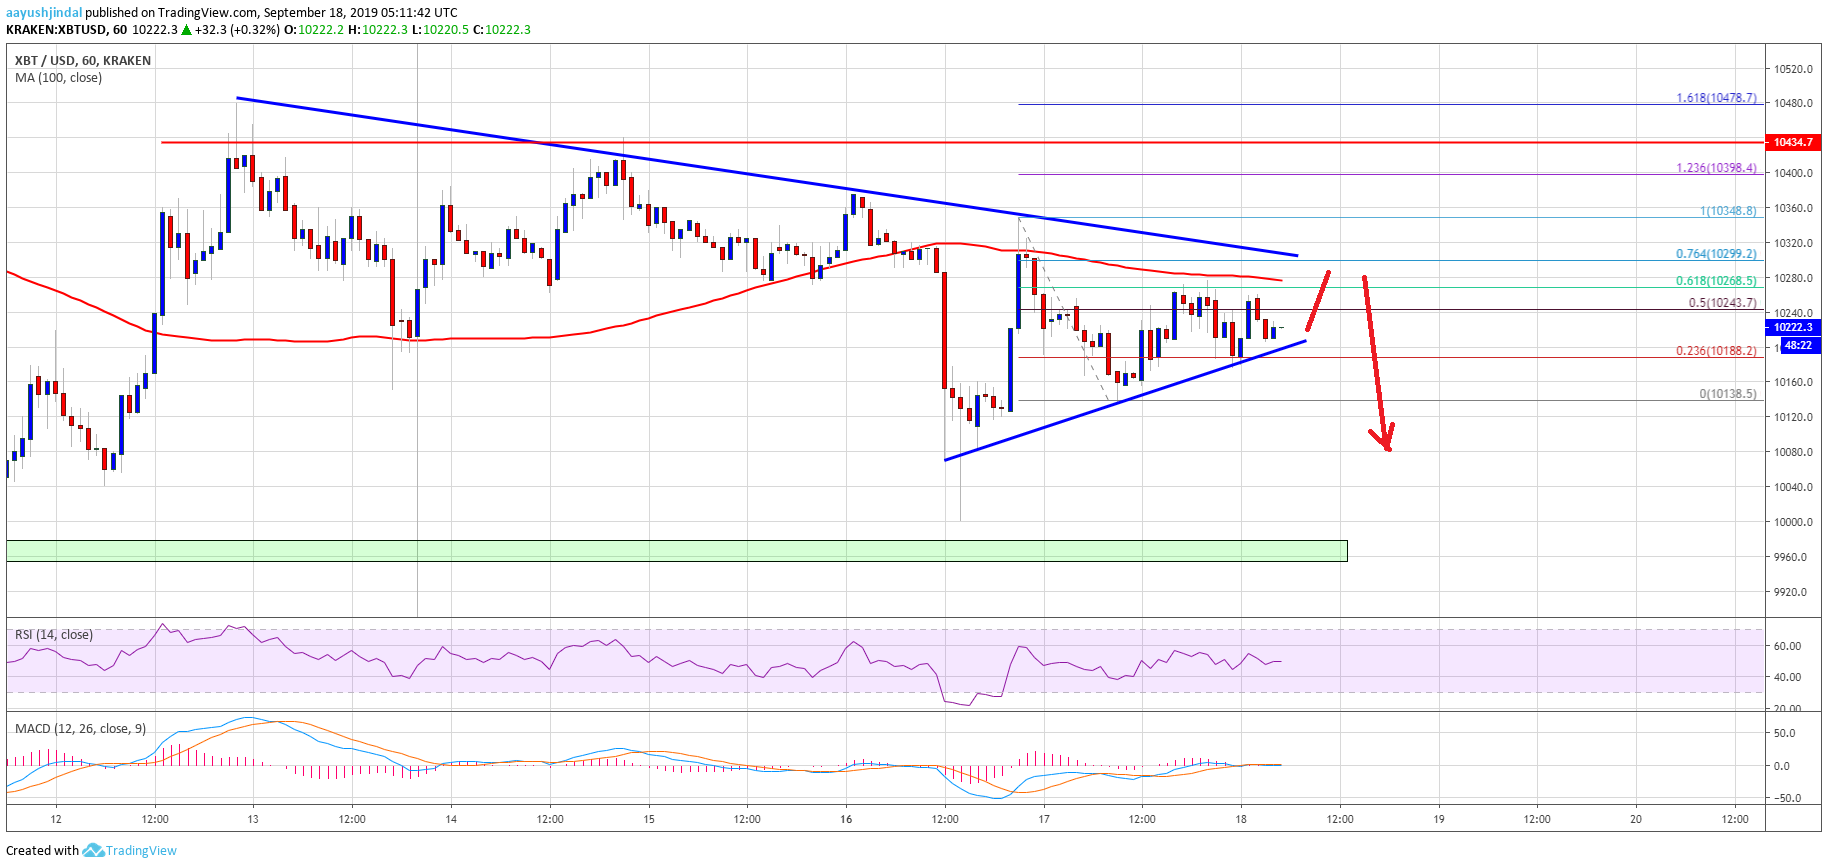
Looking at the chart, bitcoin price is clearly preparing for the next move and it could either rally above $10,400 or it might extend its decline towards the $9,900 support. The price action indicates high chances of a bearish reaction unless the bulls push the price above $10,300.
Technical indicators:
Hourly MACD – The MACD is about to move into the bearish zone.
Hourly RSI (Relative Strength Index) – The RSI for BTC/USD is just near the 50 level, with a positive bias.
Major Support Levels – $10,200 followed by $10,000.
Major Resistance Levels – $10,300, $10,340 and $10,400.


