
Reason to trust
How Our News is Made
Strict editorial policy that focuses on accuracy, relevance, and impartiality
Ad discliamer
Morbi pretium leo et nisl aliquam mollis. Quisque arcu lorem, ultricies quis pellentesque nec, ullamcorper eu odio.
- Ripple price is still struggling to surpass the main $0.2650 resistance area against the US dollar.
- The price is showing a few positive signs, but it must break the $0.2650 resistance level.
- There is a major breakout pattern forming with support near $0.2585 on the hourly chart of the XRP/USD pair (data source from Kraken).
- The price could either rally above $0.2650 or it might resume its decline below the $0.2580 level.
Ripple price is trading well below the $0.2650 resistance against the US Dollar, and ranging vs bitcoin. XRP price could soon make the next move either above $0.2650 or towards $0.2500.
Ripple Price Analysis
In the past 2-3 weeks, XRP price made many attempts to surpass the $0.2650 resistance area against the US Dollar. However, the bulls failed to gain momentum above $0.2640 and $0.2650. On the other hand, Ethereum was able to break the $185 resistance area to start an upward move. Therefore, ripple bulls need to gain pace above $0.2650 to start a solid upward move in the coming days.
The last swing low was formed near $0.2566 and the recent high was near $0.2628. At the moment, the price is correcting lower below $0.2610 and trading well above the 100 hourly simple moving average. An immediate support is near the $0.2600 level. It coincides with the 50% Fib retracement level of the recent wave from the $0.2566 low to $0.2628 high.
The main support on the downside is near the $0.2590 level and the 100 hourly simple moving average. Additionally, the 61.8% Fib retracement level of the recent wave from the $0.2566 low to $0.2628 high is near $0.2590. More importantly, there is a major breakout pattern forming with support near $0.2585 on the hourly chart of the XRP/USD pair.
Therefore, ripple price seems to be preparing for the next major break either above $0.2650 or towards $0.2500. This time, the chances of an upside break above $0.2650 are high. If the bulls gain control above $0.2650, the price could climb higher significantly towards $0.2850 or even $0.3000 in the near term. Conversely, if it fails again near $0.2650, there could be a fresh decline towards the $0.2500 support.
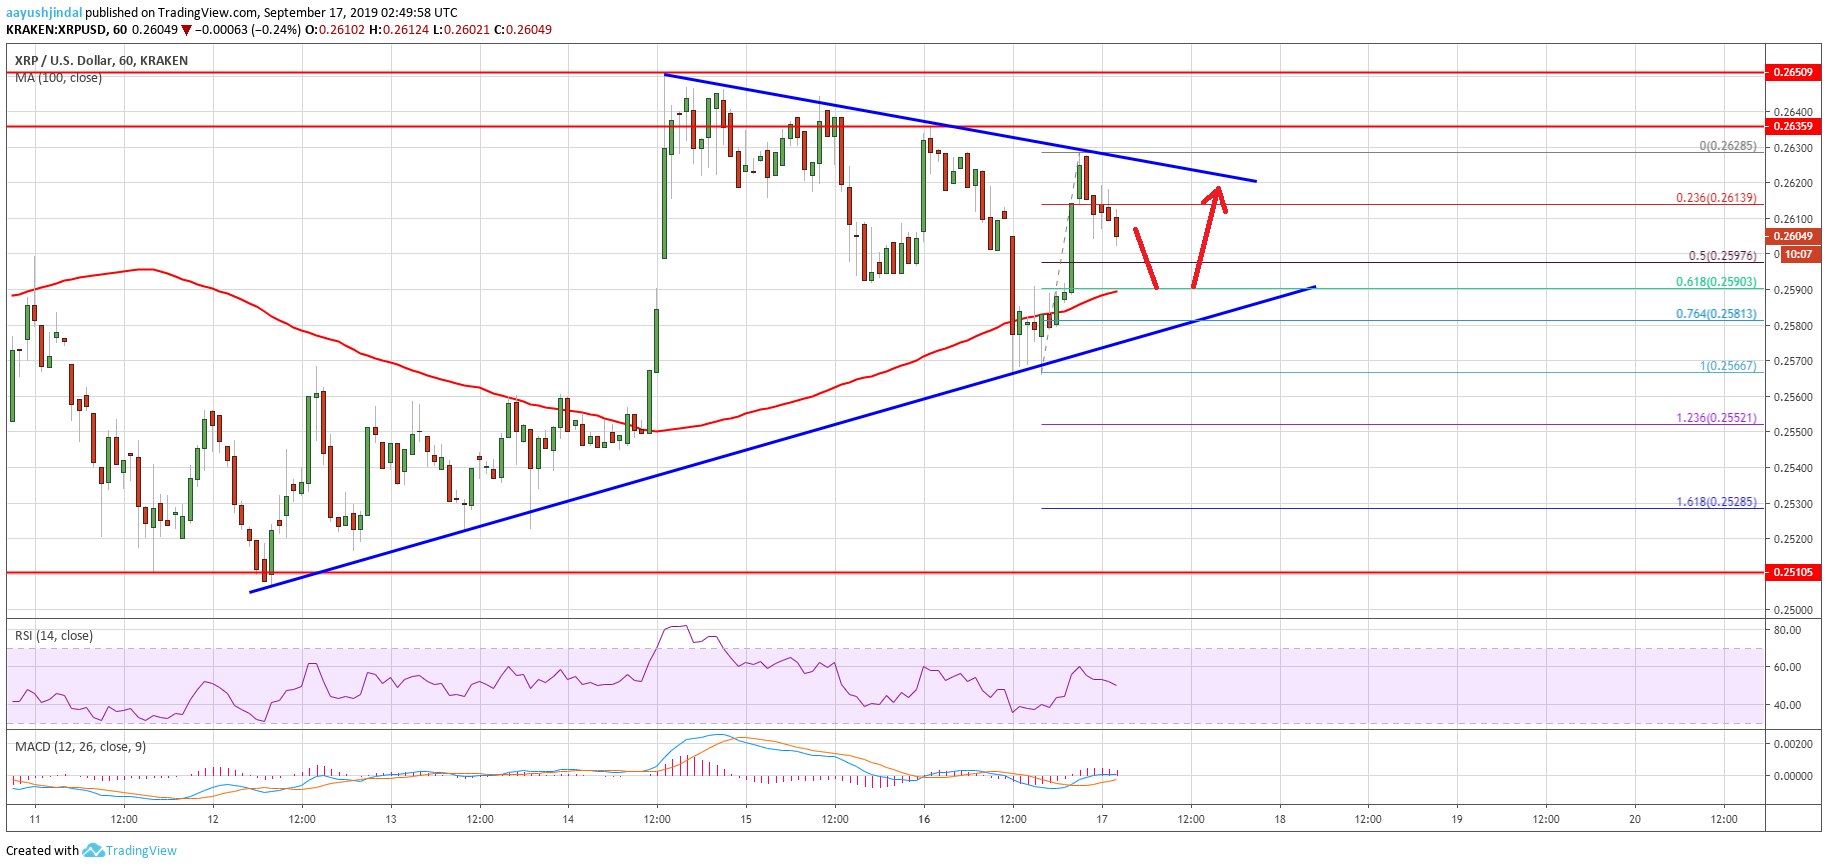
Looking at the chart, ripple price is confined in a broad range below the $0.2650 resistance. There could be more ranging moves, but sooner or later, the price is likely to break the $0.2650 resistance area.
Technical Indicators
Hourly MACD – The MACD for XRP/USD is currently placed nicely in the bullish zone.
Hourly RSI (Relative Strength Index) – The RSI for XRP/USD is correcting lower towards the 50 level.
Major Support Levels – $0.2600, $0.2580 and $0.2550.
Major Resistance Levels – $0.2640, $0.2650 and $0.2720.