Reason to trust
How Our News is Made
Strict editorial policy that focuses on accuracy, relevance, and impartiality
Ad discliamer
Morbi pretium leo et nisl aliquam mollis. Quisque arcu lorem, ultricies quis pellentesque nec, ullamcorper eu odio.
- ETH price is slowly moving down and recently broke the $180 support area against the US Dollar.
- The price could soon test the $172 or $170 level before it starts a fresh increase.
- Yesterday’s highlighted key bearish trend line is still active with resistance near $179 on the hourly chart of ETH/USD (data feed via Kraken).
- The pair is still trading in a positive zone as long as there is no close below the $170 support.
Ethereum price is in a corrective decrease versus the US Dollar, while bitcoin is consolidating. ETH price might extend its decline to $172 before it could climb again.
Ethereum Price Analysis
After forming a short term top near $186, ETH price started a downside correction against the US Dollar. It broke the $180 support level and the 100 hourly simple moving average to enter a negative zone. Moreover, the recent decline in bitcoin pushed Ethereum below the $178 level. The decline was such that the price tested the $175 support level and it is currently consolidating losses.
It corrected above the $176 level plus 23.6% Fib retracement level of the last drop from the $186 high to $175 swing low. However, the previous support area near the $180 level is acting as a resistance. Besides, the 100 hourly SMA is also preventing gains near $179. More importantly, yesterday’s highlighted key bearish trend line is still active with resistance near $179 on the hourly chart of ETH/USD.
Above the trend line, the next key resistance is near the $180 level. It coincides with the 50% Fib retracement level of the last drop from the $186 high to $175 swing low. If there is an upside break above the trend line, the 100 hourly SMA, and $180, then the price could start a fresh increase. The next key resistance area is near the $185 level, above which the price could accelerate higher.
On the downside, there is a decent support forming near the $175 level. However, it seems like there could be a downside spike before the price starts a fresh increase above the $180 level.
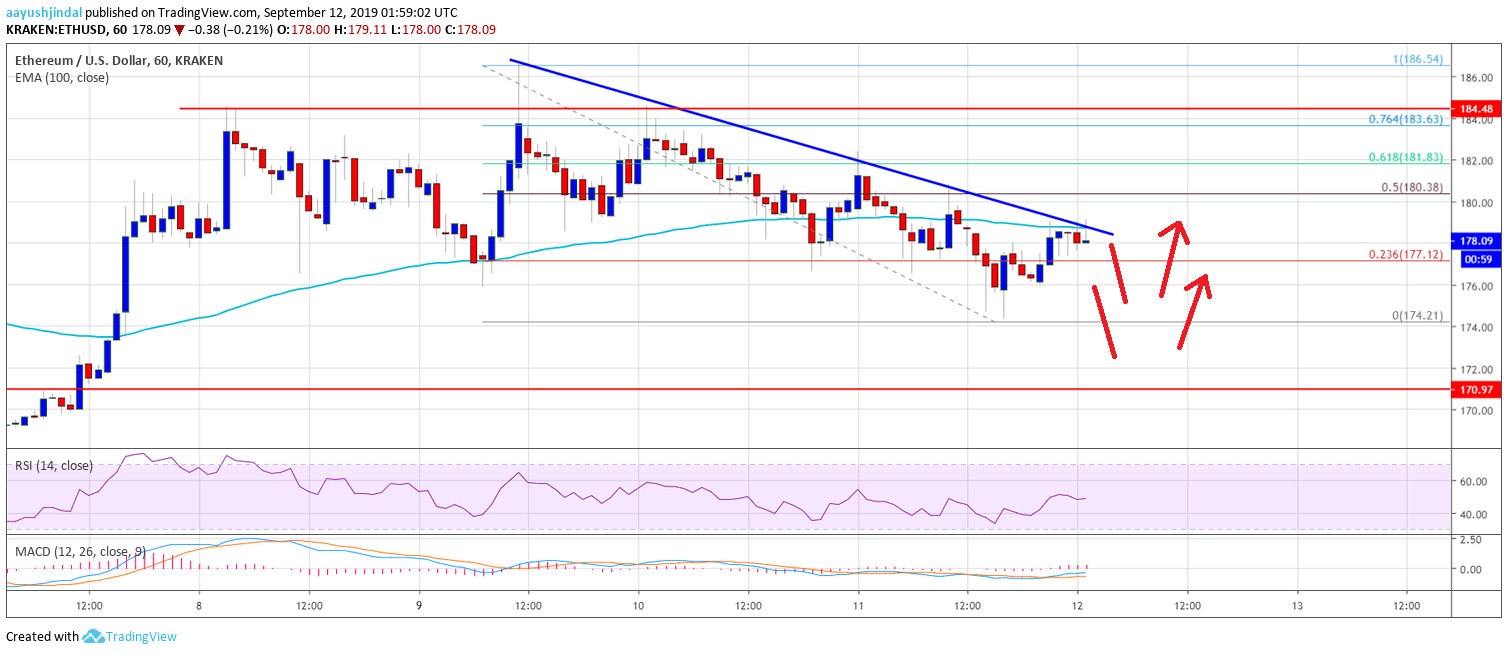
Looking at the chart, Ethereum price is clearly grinding lower below the $180 level. It seems like the price could test the $172 level before it attempts a decent upward move. Any further losses may perhaps push the price towards the key $170 support level. Overall, the price is likely to complete its correction near $172 or $170 before it could rise again.
ETH Technical Indicators
Hourly MACD – The MACD for ETH/USD is showing a few bearish signs.
Hourly RSI – The RSI for ETH/USD is currently below the 50 level, with a bearish angle.
Major Support Level – $172
Major Resistance Level – $180