Reason to trust
How Our News is Made
Strict editorial policy that focuses on accuracy, relevance, and impartiality
Ad discliamer
Morbi pretium leo et nisl aliquam mollis. Quisque arcu lorem, ultricies quis pellentesque nec, ullamcorper eu odio.
- ETH price is struggling to continue to move higher above the $185 resistance against the US Dollar.
- The price is likely to decline if bitcoin continues to struggle below the $10,250 level.
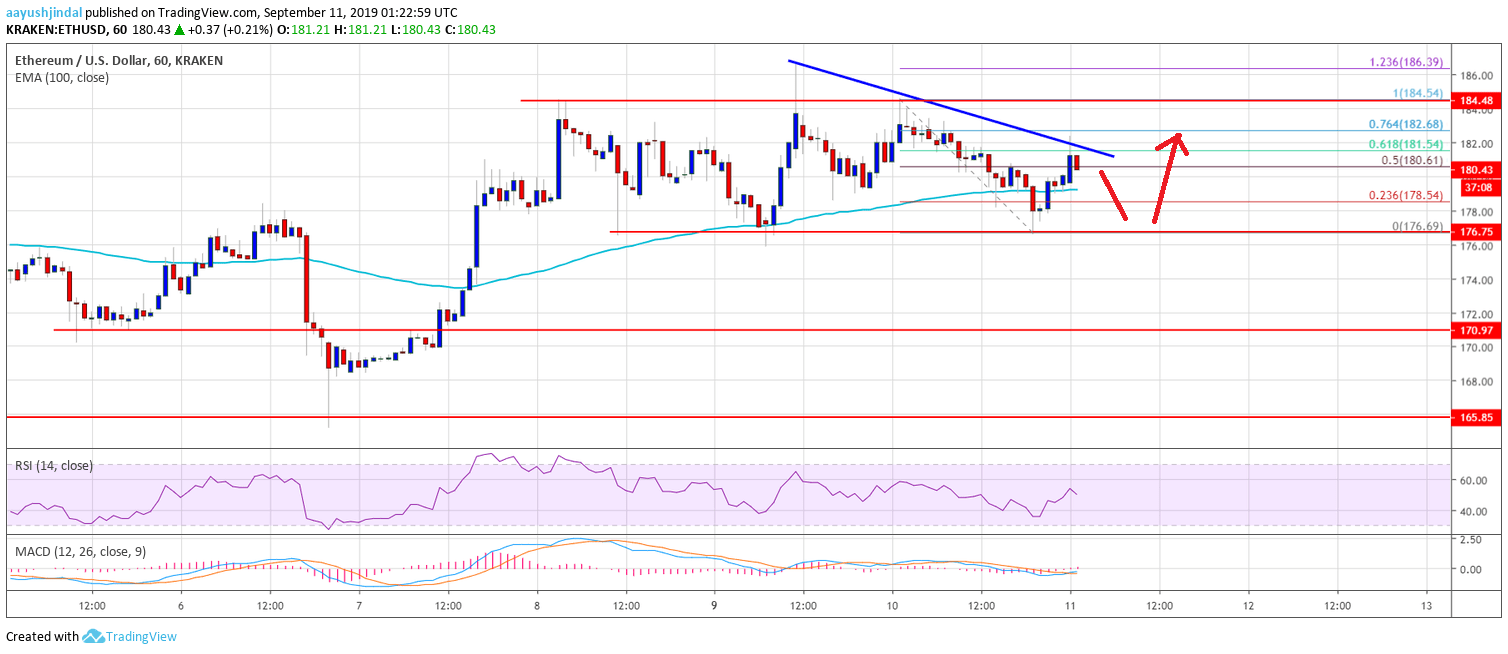
- There is a connecting bearish trend line forming with resistance near $182 on the hourly chart of ETH/USD (data feed via Kraken).
- The price remains at a risk of more downsides as long as the price is below $185.
Ethereum price is struggling to gain strength above $185 versus the US Dollar since bitcoin is declining. ETH price could spike below the $180 support in the near term.
Ethereum Price Analysis
In the past two days, ETH price made two attempts to surpass the $185 resistance against the US Dollar. However, bitcoin price struggled to climb higher above the $10,350 and $10,400 resistance levels. As a result, Ether price also started showing a few bearish signs below the $185 resistance. On the positive side, the price is holding the main $178 and $180 support levels.
The last swing low was formed near the $177 level. The price is currently correcting higher above the $178 and $179 levels. Moreover, there was a break above the 50% Fib retracement level of the recent decline from the $185 swing high to $177 swing low. On the upside, the $182 level is currently protecting gains. Additionally, there is a connecting bearish trend line forming with resistance near $182 on the hourly chart of ETH/USD.
The 61.8% Fib retracement level of the recent decline from the $185 swing high to $177 swing low is also acting as a resistance. If there is an upside break above $182, Ethereum price could revisit the $185 resistance level. To continue higher and start a decent rise, the price must break the $185 and $186 resistance levels.
On the upside, an initial support is near the $180 level and the 100 hourly simple moving average. The next key support is near the $178 level. If there is a downside break below the last swing low, the price could correct further lower towards the $170 support area in the near term.
Looking at the chart, Ethereum price seems to be currently consolidating in a range below the $182 and $185 resistance levels However, if bitcoin price continues to slide, there are chances of a sharp downward move move in ETH below the $175 support area in the coming sessions.
ETH Technical Indicators
Hourly MACD – The MACD for ETH/USD is likely to move back into the bullish zone.
Hourly RSI – The RSI for ETH/USD is currently above the 50 level, with a minor bearish angle.
Major Support Level – $178
Major Resistance Level – $185