
Reason to trust
How Our News is Made
Strict editorial policy that focuses on accuracy, relevance, and impartiality
Ad discliamer
Morbi pretium leo et nisl aliquam mollis. Quisque arcu lorem, ultricies quis pellentesque nec, ullamcorper eu odio.
- ETH price is finding a strong buying interest near the $165 level against the US Dollar.
- The price is currently climbing higher and testing a major resistance area near $180 and $182.
- There was a break above a major bearish trend line with resistance near $176 on the 4-hours chart of ETH/USD (data feed via Kraken).
- There are a few bullish signs emerging, suggesting an upside break above the $182 resistance.
Ethereum price is showing positive signs against the US Dollar, while bitcoin is rising. ETH might surge once it clears the main $180 and $182 resistance levels.
Ethereum Price Weekly Analysis
This past week, there was a major rejection noted near the $180 resistance in ETH against the US Dollar. However, bitcoin price remained well bid and gained traction above the $10,500 resistance. However, Ether declined below the $170 level and 100 simple moving average (4-hours). Moreover, the price retested the main $165 support area, where the bulls took a stand.
A swing low was formed near $165 and the price recently climbed higher. It broke the $175 resistance plus the 50% Fib retracement level of the last decline from the $183 high to $165 swing low. Moreover, there was a break above a major bearish trend line with resistance near $176 on the 4-hours chart of ETH/USD. The pair is now trading with a positive bias above the $175 level.
It is currently trading near the 76.4% Fib retracement level of the last decline from the $183 high to $165 swing low. Additionally, it is testing the $180 resistance and the 100 simple moving average (4-hours). If there is an upside break above the $180 and $182 resistance levels, there could be more gains. The next resistance is near the $188 level plus the 1.236 Fib extension level of the last decline from the $183 high to $165 swing low.
On the other hand, there could be another downside reaction if there is no upside break above the $182 resistance. An immediate support is near the $175 level, below which the price could test $170.
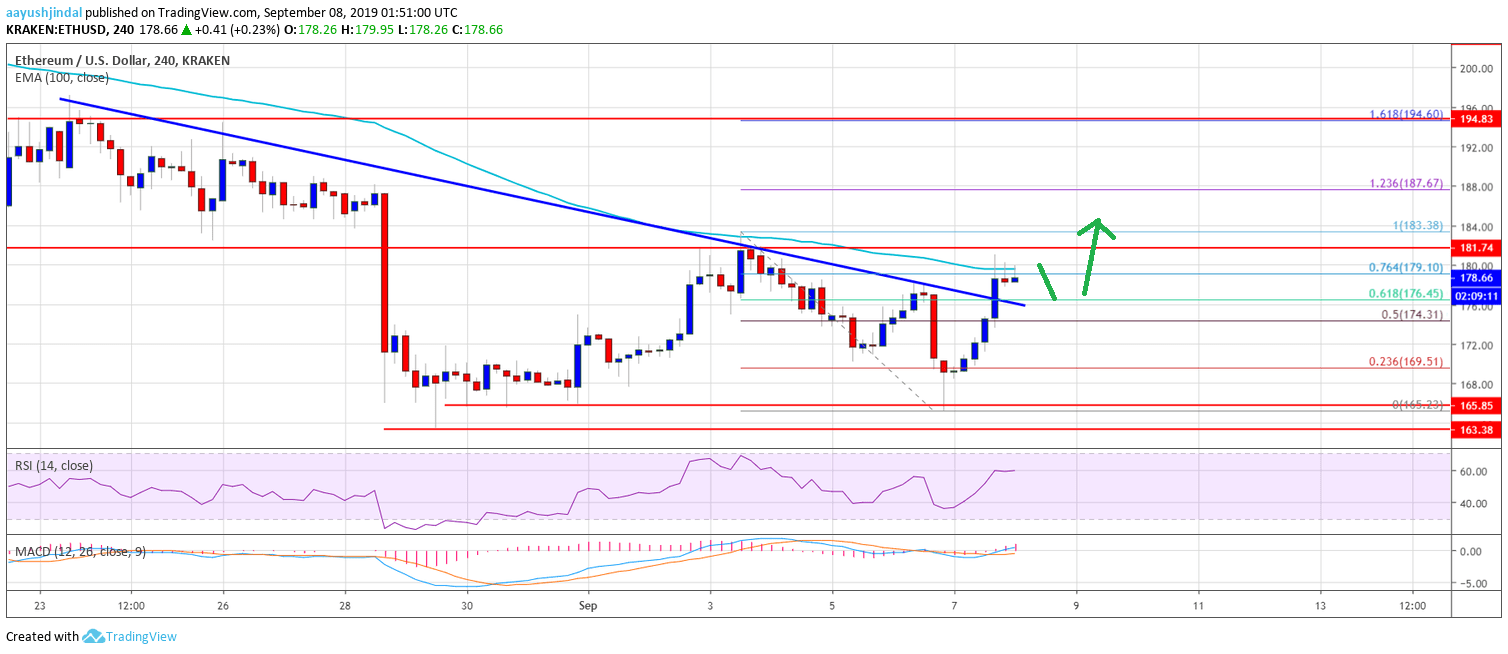
The above chart indicates that Ethereum price is clearly showing a few positive signs above the $175 level. If he bulls gain traction above $180 and $182, there could be a bullish reversal towards $190 and $195. On the downside, the main support is near the $165 level, below which the price could turn bearish in the near term.
Technical Indicators
4 hours MACD – The MACD for ETH/USD is slowly gaining momentum in the bullish zone.
4 hours RSI – The RSI for ETH/USD is currently well above the 50 level, with a flat bias.
Major Support Level – $165
Major Resistance Level – $182


