
Reason to trust
How Our News is Made
Strict editorial policy that focuses on accuracy, relevance, and impartiality
Ad discliamer
Morbi pretium leo et nisl aliquam mollis. Quisque arcu lorem, ultricies quis pellentesque nec, ullamcorper eu odio.
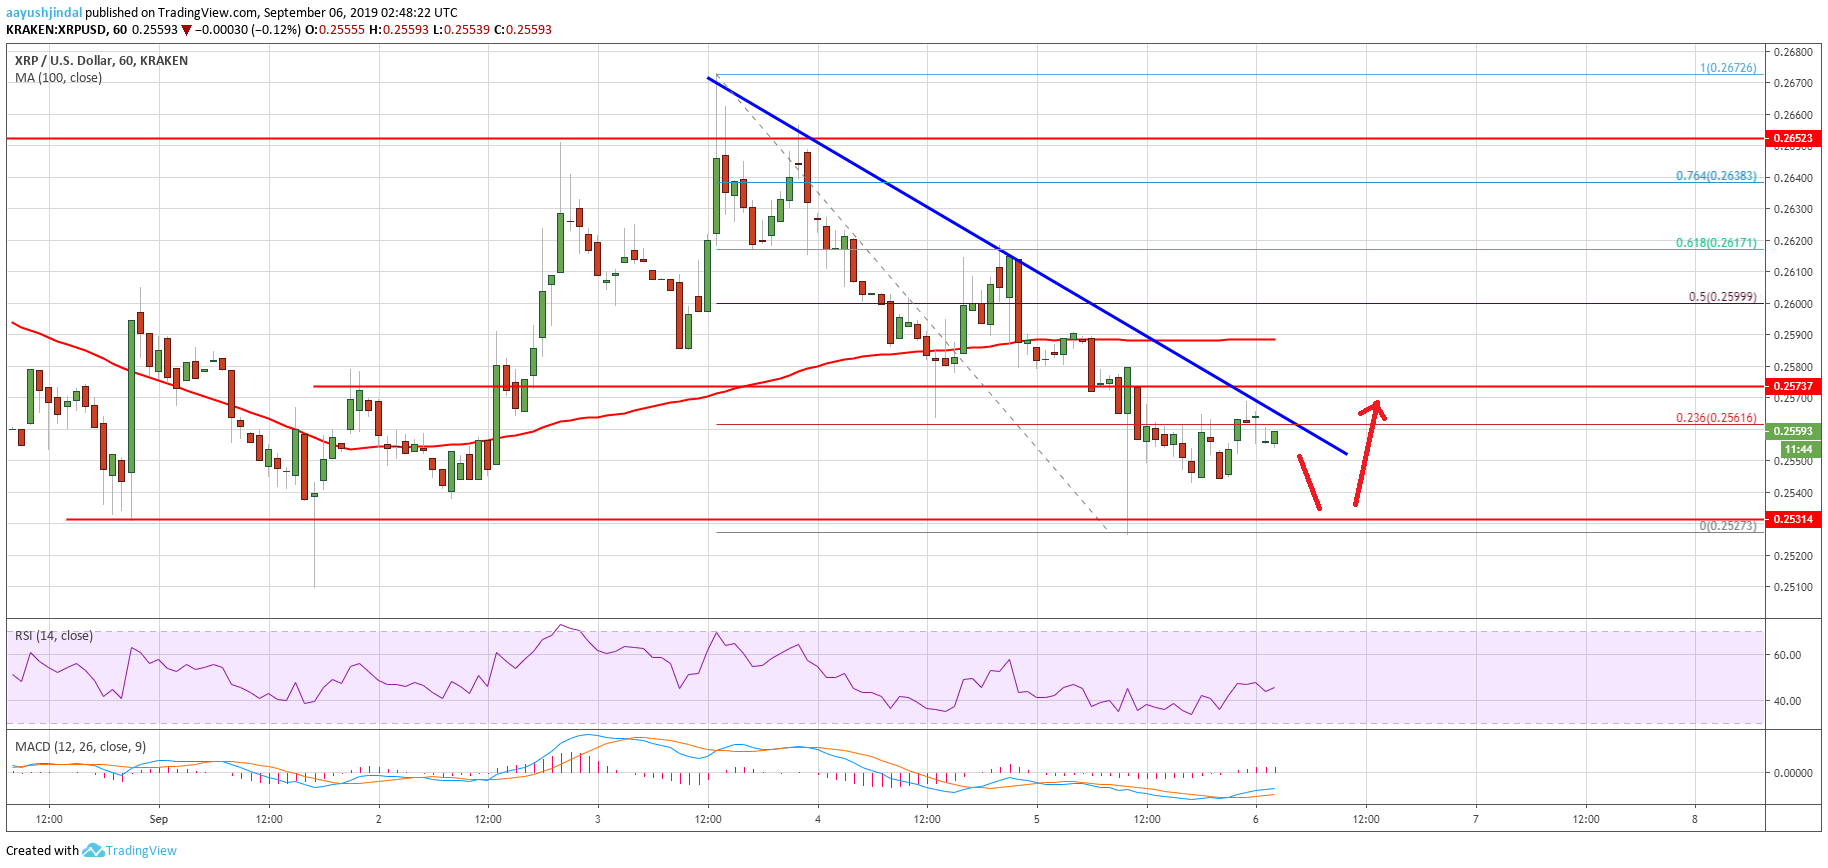
- Ripple price extended its decline and traded towards the $0.2520 level against the US dollar.
- The price is currently correcting higher, but it is facing resistance near the $0.2570-$0.2580 area.
- There is a key bearish trend line forming with resistance near $0.2565 on the hourly chart of the XRP/USD pair (data source from Kraken).
- The price remains at a risk of more downsides if it fails to stay above the $0.2520 and $0.2500 supports.
Ripple price is trading in a bearish zone against the US Dollar and bitcoin. XRP price could bounce back if it stays above the $0.2520 support area in the near term.
Ripple Price Analysis
Yesterday, we saw a fresh drop in XRP price from the $0.2650 resistance against the US Dollar. The price mostly followed a bearish path below the $0.2620 and $0.2600 levels. Moreover, there was a close below the $0.2600 level and the 100 hourly simple moving average. Ripple extended its decline below the $0.2580 level and traded close to the $0.2520 level.
A swing low was formed near $0.2527 and the price is currently correcting higher. It traded above the $0.2550 level plus the 23.6% Fib retracement level of the recent decline from the $0.2672 high to $0.2527 low. Moreover, there is a key bearish trend line forming with resistance near $0.2565 on the hourly chart of the XRP/USD pair. Above the trend line, the next resistance is near the $0.2590 level and the 100 hourly SMA.
Finally, the 50% Fib retracement level of the recent decline from the $0.2672 high to $0.2527 low is near the $0.2600 level to act as a resistance. The main resistance for the bulls is near the $0.2650 level, above which there are chances of a solid upward move in the coming days. In the mentioned case, ripple could surge towards the $0.2800 and $0.2820 levels.
Conversely, if the price continues to struggle below $0.2600 and $0.2650, there could be additional losses. An immediate support is near the $0.2520 and $0.2500 levels. Below $0.2500, the price could tumble sharply towards the $0.2400 level in the near term.
Looking at the chart, ripple price is slowly recovering above the $0.2550 level. However, the bulls are likely to face selling interest near the $0.2580 and $0.2600 levels. As long as the price is trading below $0.2600 and $0.2650, the price could extend its decline towards or below $0.2500.
Technical Indicators
Hourly MACD – The MACD for XRP/USD is slowly moving in the bullish zone.
Hourly RSI (Relative Strength Index) – The RSI for XRP/USD is currently declining and it is below the 50 level.
Major Support Levels – $0.2540, $0.2520 and $0.2500.
Major Resistance Levels – $0.2580, $0.2600 and $0.2650.