
Reason to trust
How Our News is Made
Strict editorial policy that focuses on accuracy, relevance, and impartiality
Ad discliamer
Morbi pretium leo et nisl aliquam mollis. Quisque arcu lorem, ultricies quis pellentesque nec, ullamcorper eu odio.
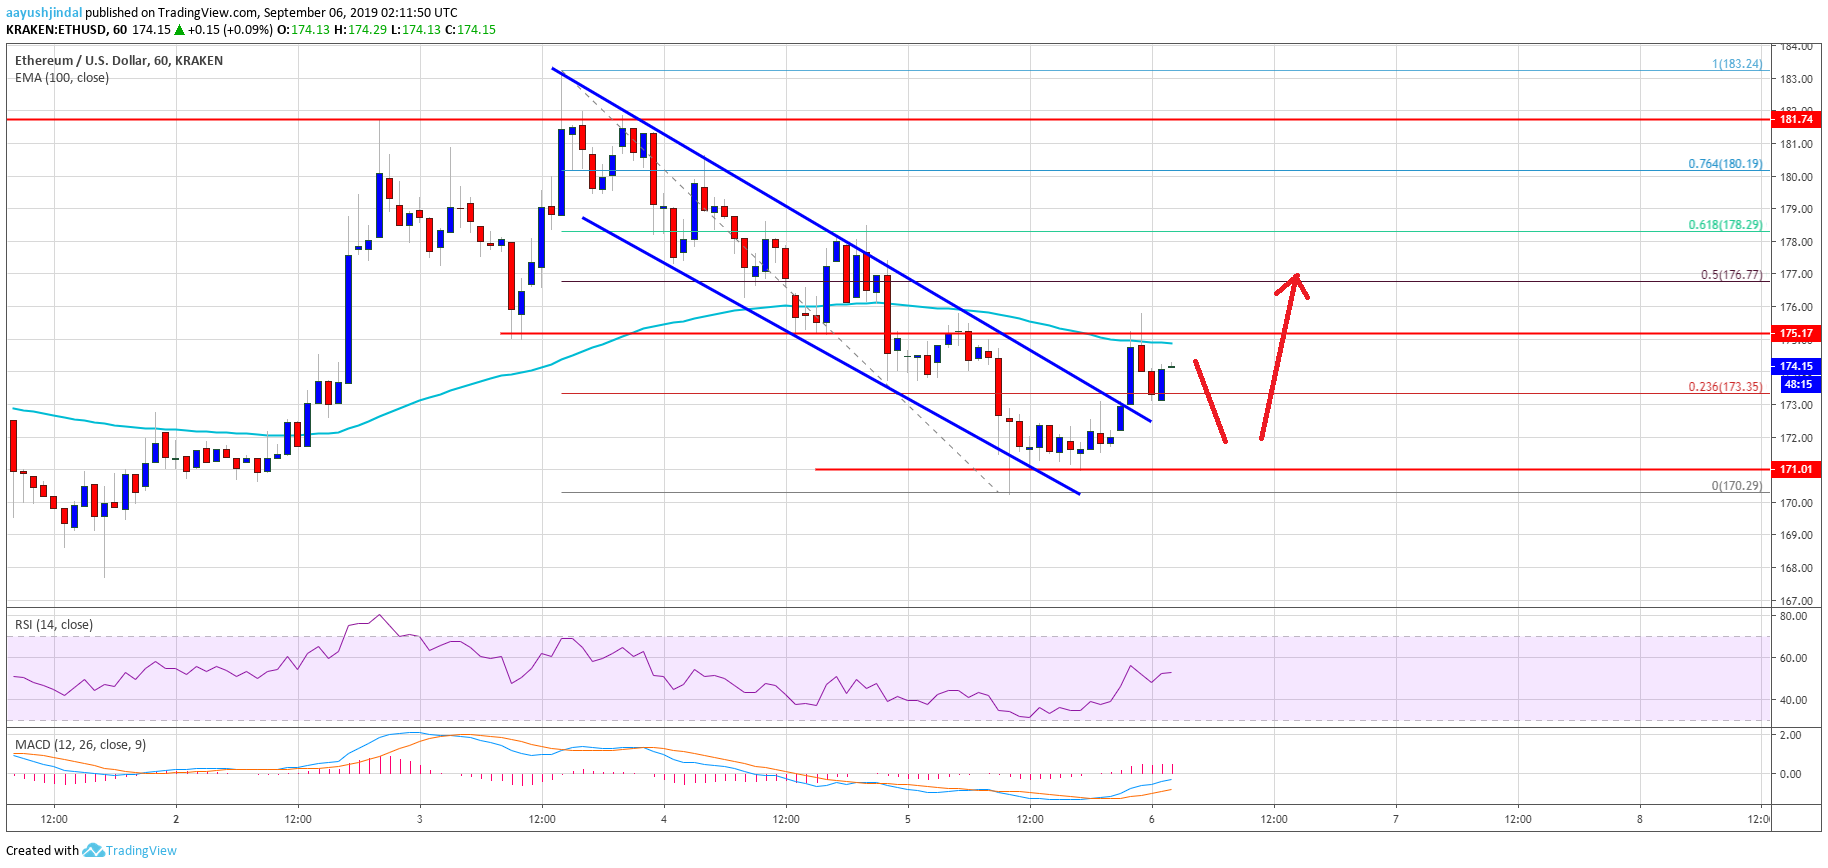
- ETH price extended its decline and tested the $170 support area against the US Dollar.
- The price is currently correcting higher, but it is struggling to break the $175 resistance area.
- There was a break above a major declining channel with resistance near $173 on the hourly chart of ETH/USD (data feed via Kraken).
- The bulls need to push the price above $175 and the 100 hourly simple moving average.
Ethereum price is facing hurdles near $175 versus the US Dollar, while bitcoin is consolidating. ETH price could decline again before it attempts a fresh increase.
Ethereum Price Analysis
Yesterday, we saw a bearish reaction in ETH price below the $178 level against the US Dollar. However, bitcoin price remained well bid above the $10,400 and $10,500 support levels. Recently, Ethereum price extended its decline below the $175 level and the 100 hourly simple moving average. Moreover, there was a break below the $172 level and the price tested the $170 support area.
A swing low was formed near $170 and the price is currently correcting higher. It traded above the $172 resistance level. Moreover, the price climbed above the 23.6% Fib retracement level of the downward move from the $183 high to $170 swing low. More importantly, there was a break above a major declining channel with resistance near $173 on the hourly chart of ETH/USD.
However, Ethereum price seems to be facing a strong resistance near the $175 level. Additionally, the 100 hourly simple moving average is also stopping gains near the $175 level. The next key resistance is near the $178 level. It coincides with the 50% Fib retracement level of the downward move from the $183 high to $170 swing low. The main hurdles for the bulls are still near the $180 and $182 levels.
On the downside, an immediate support is near the $172 level. The main support is now near the $170 level, below which there is a risk of another drop towards the $168 support. The next key support is near the $162 pivot level.
Looking at the chart, Ethereum price is clearly struggling to clear the $175 resistance area and the 100 hourly SMA. Therefore, there could be another bearish reaction before the price attempts an upside break above $175. The next key resistances are near the $178 and $180 levels. A convincing close above the $180 level is needed for a sustained upward move.
ETH Technical Indicators
Hourly MACD – The MACD for ETH/USD is currently placed in the bullish zone.
Hourly RSI – The RSI for ETH/USD is currently well above the 50 level, with a positive bias.
Major Support Level – $170
Major Resistance Level – $178


