- ETH price failed to settle above $180 and started a fresh decrease against the US Dollar.
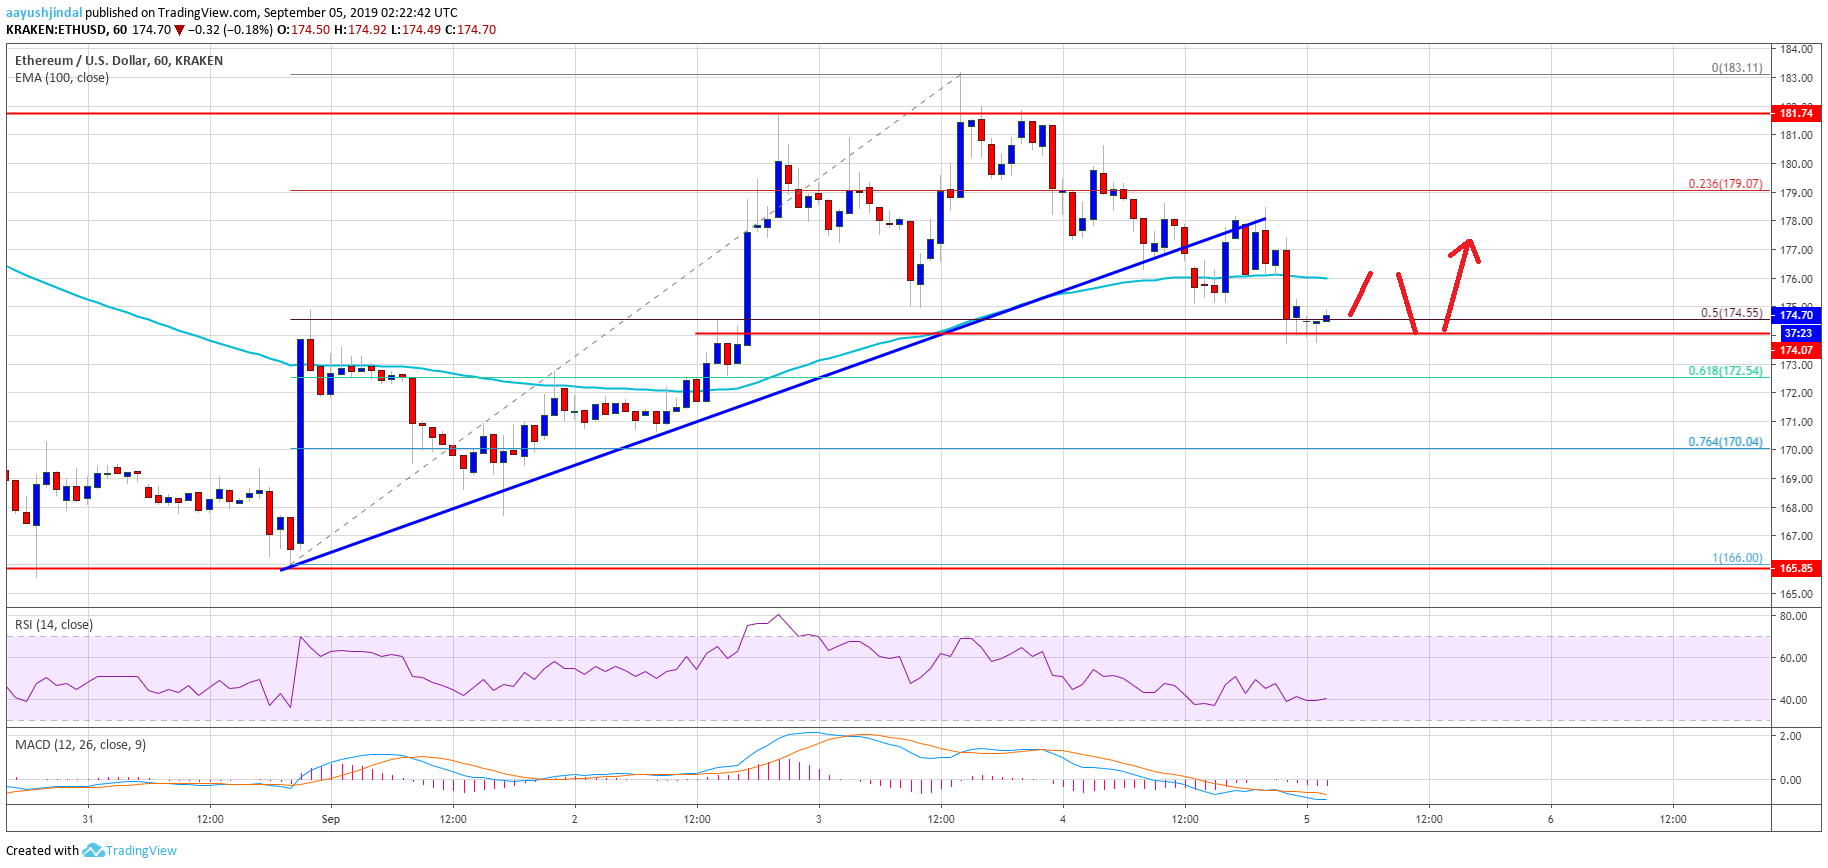
- The price is currently trading near the $174 support and it could bounce back in the near term.
- There was a break below a major bullish trend line with support at $177 on the hourly chart of ETH/USD (data feed via Kraken).
- Bitcoin price is still holding the $10,500 support area and it could climb higher in the near term.
Ethereum price is struggling to hold gains versus the US Dollar, while bitcoin is trading nicely. ETH price is under pressure and it could either rise again or break below $172.
Ethereum Price Analysis
Yesterday, there were further gains in bitcoin above $10,500 against the US Dollar. However, Ethereum and ripple struggled to continue higher above $182 and $0.2650 respectively. As a result, ETH price declined below the $180 level and started a downside correction. The price also declined below the $178 support level and the 100 hourly simple moving average.
Moreover, the price declined below the 23.6% Fib retracement level of the last major upward move from the $166 swing low to $183 swing high. There was also a break below a major bullish trend line with support at $177 on the hourly chart of ETH/USD. The pair is now trading near the $174 support. Additionally, the 50% Fib retracement level of the last major upward move from the $166 swing low to $183 swing high is acting as a support.
If there are more downside, the price might test the $172 support area in the coming sessions. It coincides with the 61.8% Fib retracement level of the last major upward move from the $166 swing low to $183 swing high. On the upside, there is a key resistance forming near the $176 level and the 100 hourly SMA. However, the main resistance for the bulls is still near the $180 and $182 levels.
The current price action suggests a downside spike towards the $172 support level before the price attempts an upward move. Conversely, the price might continue to move down and it could even break the $170 support.
Looking at the chart, Ethereum price is struggling to continue higher and is currently trading near the key $174 support area. If the price fails to hold the $174 or $172 support, it could decline further. Otherwise, it may revisit the main $180-$182 resistance area.
ETH Technical Indicators
Hourly MACD – The MACD for ETH/USD is currently gaining momentum in the bearish zone.
Hourly RSI – The RSI for ETH/USD is currently near the 40 level, with a flat structure.
Major Support Level – $172
Major Resistance Level – $180-$182


