Reason to trust
How Our News is Made
Strict editorial policy that focuses on accuracy, relevance, and impartiality
Ad discliamer
Morbi pretium leo et nisl aliquam mollis. Quisque arcu lorem, ultricies quis pellentesque nec, ullamcorper eu odio.
- Ripple price made another attempt to settle above the key $0.2650 resistance against the US dollar.
- The price is currently correcting, but it remains well supported near the $0.2600 level.
- There is a breakout pattern forming with resistance near the $0.2650 level on the hourly chart of the XRP/USD pair (data source from Kraken).
- The price is likely to climb higher sharply once it clears the $0.2650 and $0.2665 resistance levels.
Ripple price is trading with a positive bias against the US Dollar, while bitcoin surpassed $10,500. XRP price could accelerate gains once it settles above the $0.2650 resistance.
Ripple Price Analysis
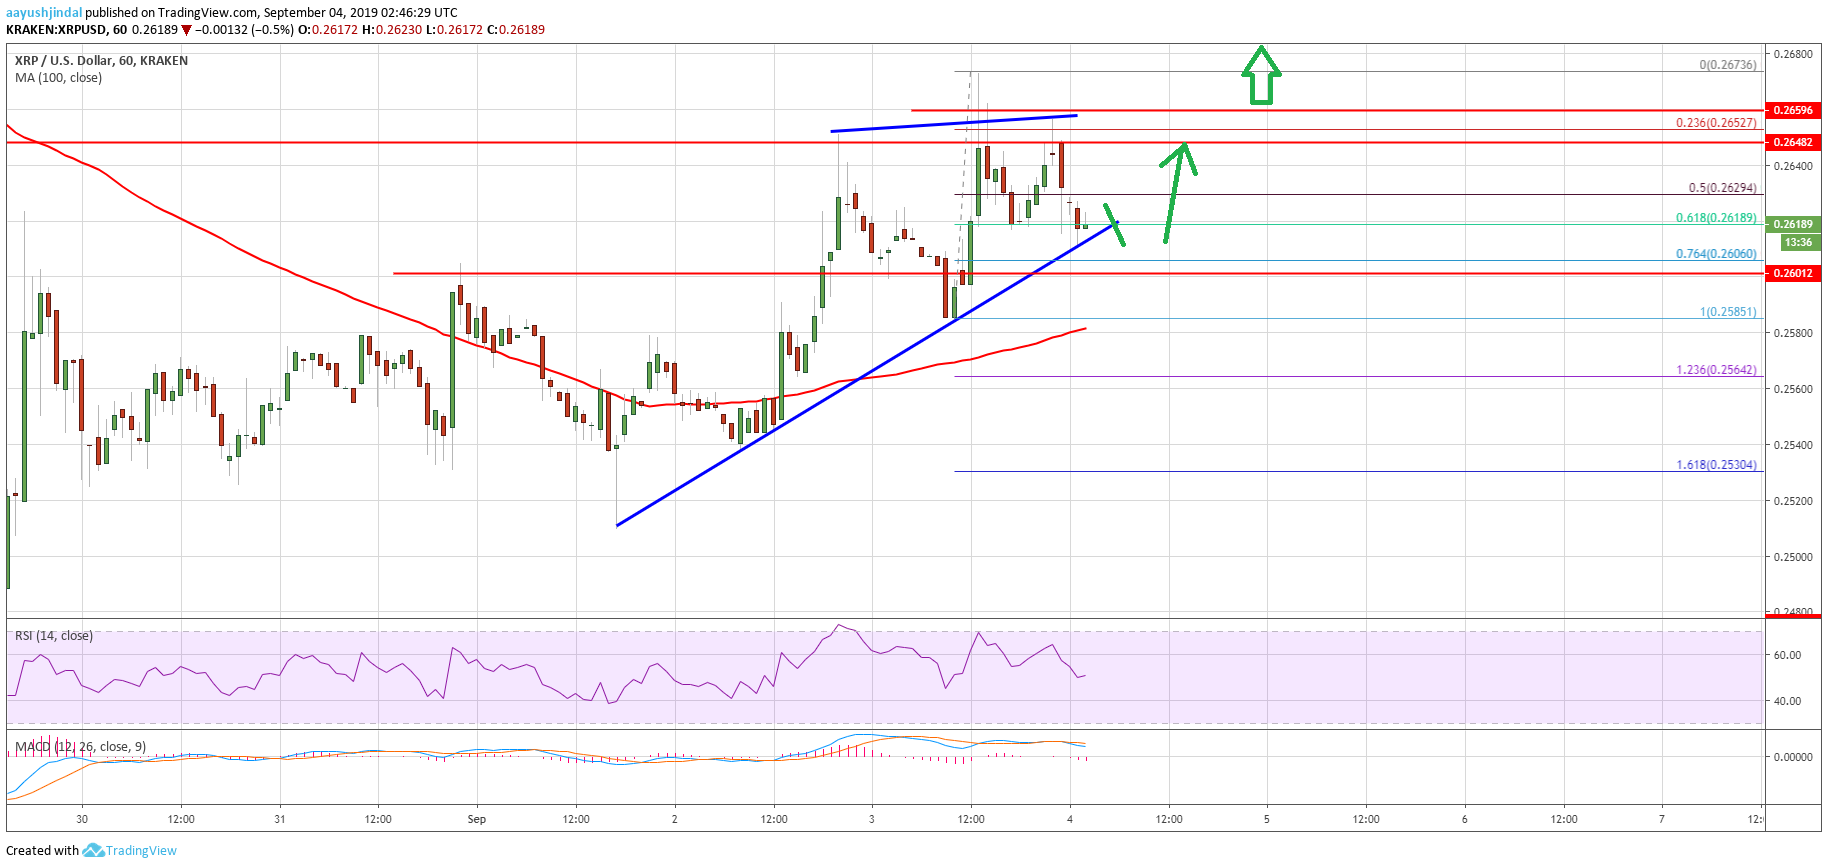
Recently, there was a slow and steady rise in XRP price above $0.2550 against the US Dollar. Moreover, the price even settled above the $0.2600 resistance and the 100 hourly simple moving average. However, the bulls seem to be struggling to gain momentum above the $0.2650 resistance area. In the past three sessions, the price made more than two attempts to settle above $0.2650, but it failed.
The last swing high was formed near $0.2673 before the price started a downside correction. It traded below the $0.2630 level plus the 50% Fib retracement level of the last leg from the $0.2585 low to $0.2673 high. However, there are a few decent supports forming near $0.2620 and $0.2600. Additionally, the price is testing the 61.8% Fib retracement level of the last leg from the $0.2585 low to $0.2673 high.
More importantly, there is a breakout pattern forming with resistance near the $0.2650 level on the hourly chart of the XRP/USD pair. If there is a downside break below the $0.2620 level, the price might find support near $0.2600. If there are more downsides, the next key support is near the $0.2580 level since it coincides with the 100 hourly simple moving average.
Conversely, if there is an upside break above $0.2650 and $0.2665, the price could accelerate gains. The next key resistance is near the $0.2700 and $0.2720 levels. Above $0.2720, the price will most likely climb towards the $0.2800 resistance area in the near term.
Looking at the chart, ripple price is currently trading nicely above the $0.2620 and $0.2600 supports. Having said that, the price must settle above the $0.2650 resistance to gain bullish momentum. If it continues to struggle, there are chances of a downside reaction below the $0.2600 support level in the coming sessions.
Technical Indicators
Hourly MACD – The MACD for XRP/USD is slowly gaining momentum in the bearish zone.
Hourly RSI (Relative Strength Index) – The RSI for XRP/USD is currently struggling to stay above the 50 level.
Major Support Levels – $0.2620, $0.2600 and $0.2580.
Major Resistance Levels – $0.2650, $0.2665 and $0.2720.