
Reason to trust
How Our News is Made
Strict editorial policy that focuses on accuracy, relevance, and impartiality
Ad discliamer
Morbi pretium leo et nisl aliquam mollis. Quisque arcu lorem, ultricies quis pellentesque nec, ullamcorper eu odio.
- ETH price recovered nicely above the $172 and $175 resistance levels against the US Dollar.
- The price is currently struggling to break an important resistance area near the $180 level.
- There is a new key bullish trend line forming with support near $175 on the hourly chart of ETH/USD (data feed via Kraken).
- Bitcoin price surged more than 6% in the past few hours and broke the main $10,000 resistance.
Ethereum price is testing key resistance after a decent rally versus the US Dollar, and bitcoin is up 6%. ETH price seems to be struggling near $180 and is correcting lower.
Ethereum Price Analysis
Yesterday, we discussed a few key resistances for ETH price near the $172 and $175 levels against the US Dollar. The price rallied recently and broke the $175 resistance level. Moreover, there was a close above the $175 level and the 100 hourly simple moving average. More importantly, bitcoin price performed really well and surged above the $10,000 and $10,200 resistance levels.
However, Ethereum price ran into a crucial resistance area near $180 (as discussed in the weekly forecast). It faced a strong resistance and failed to continue higher above $180. A swing high was formed near $182 and the price is currently correcting gains. It traded below the 23.6% Fib retracement level of the recent rally from the $168 swing low to $182 high.
On the downside, there are a couple of important supports near the $175 level. Additionally, there is a new key bullish trend line forming with support near $175 on the hourly chart of ETH/USD. The 50% Fib retracement level of the recent rally from the $168 swing low to $182 high is also waiting near the trend line support. Therefore, the $175 level might act as a strong support in the near term.
If the price fails to stay above the $175 support, it could decline further towards the $173 level and the 100 hourly simple moving average. On the upside, the main resistance is near the $180 and $182 levels. A successful close above $180 is needed for bullish continuation. The next key resistances are near the $190 and $192 levels.
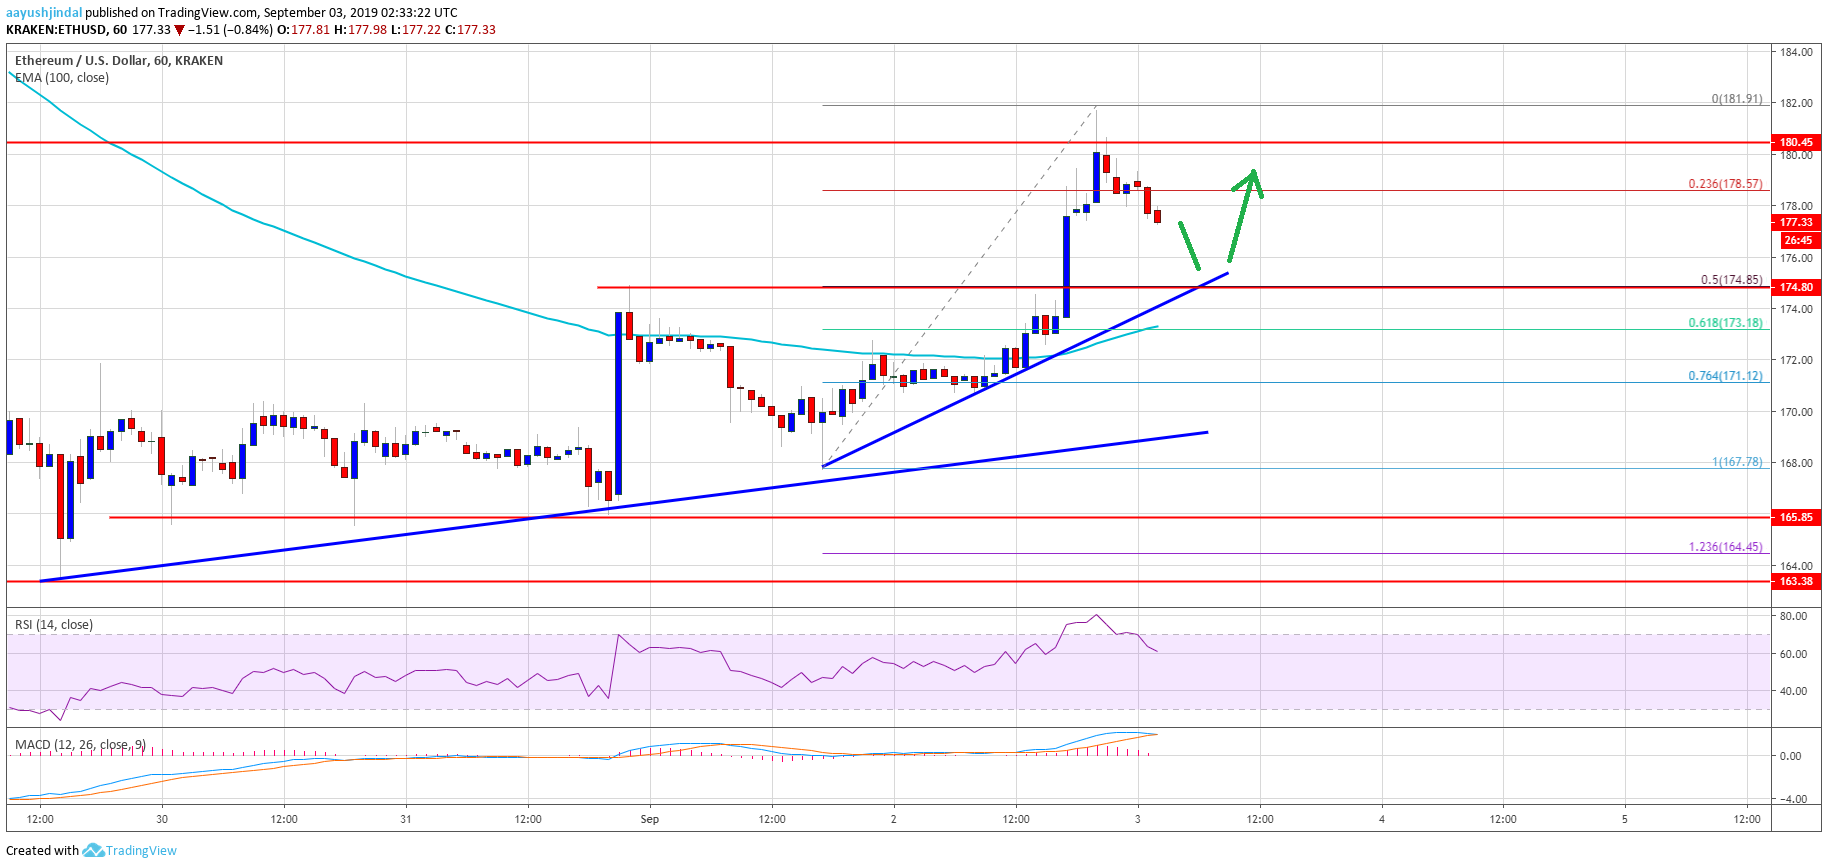
Looking at the chart, Ethereum price is clearly retreating from the $180 resistance level. On the downside, the $175 level holds the key. If the price fails to bounce back from $175, it might resume its decline in the coming sessions.
ETH Technical Indicators
Hourly MACD – The MACD for ETH/USD is slowly losing momentum in the bullish zone.
Hourly RSI – The RSI for ETH/USD is currently correcting lower towards the 60 level.
Major Support Level – $175
Major Resistance Level – $180-$182