
Reason to trust
How Our News is Made
Strict editorial policy that focuses on accuracy, relevance, and impartiality
Ad discliamer
Morbi pretium leo et nisl aliquam mollis. Quisque arcu lorem, ultricies quis pellentesque nec, ullamcorper eu odio.
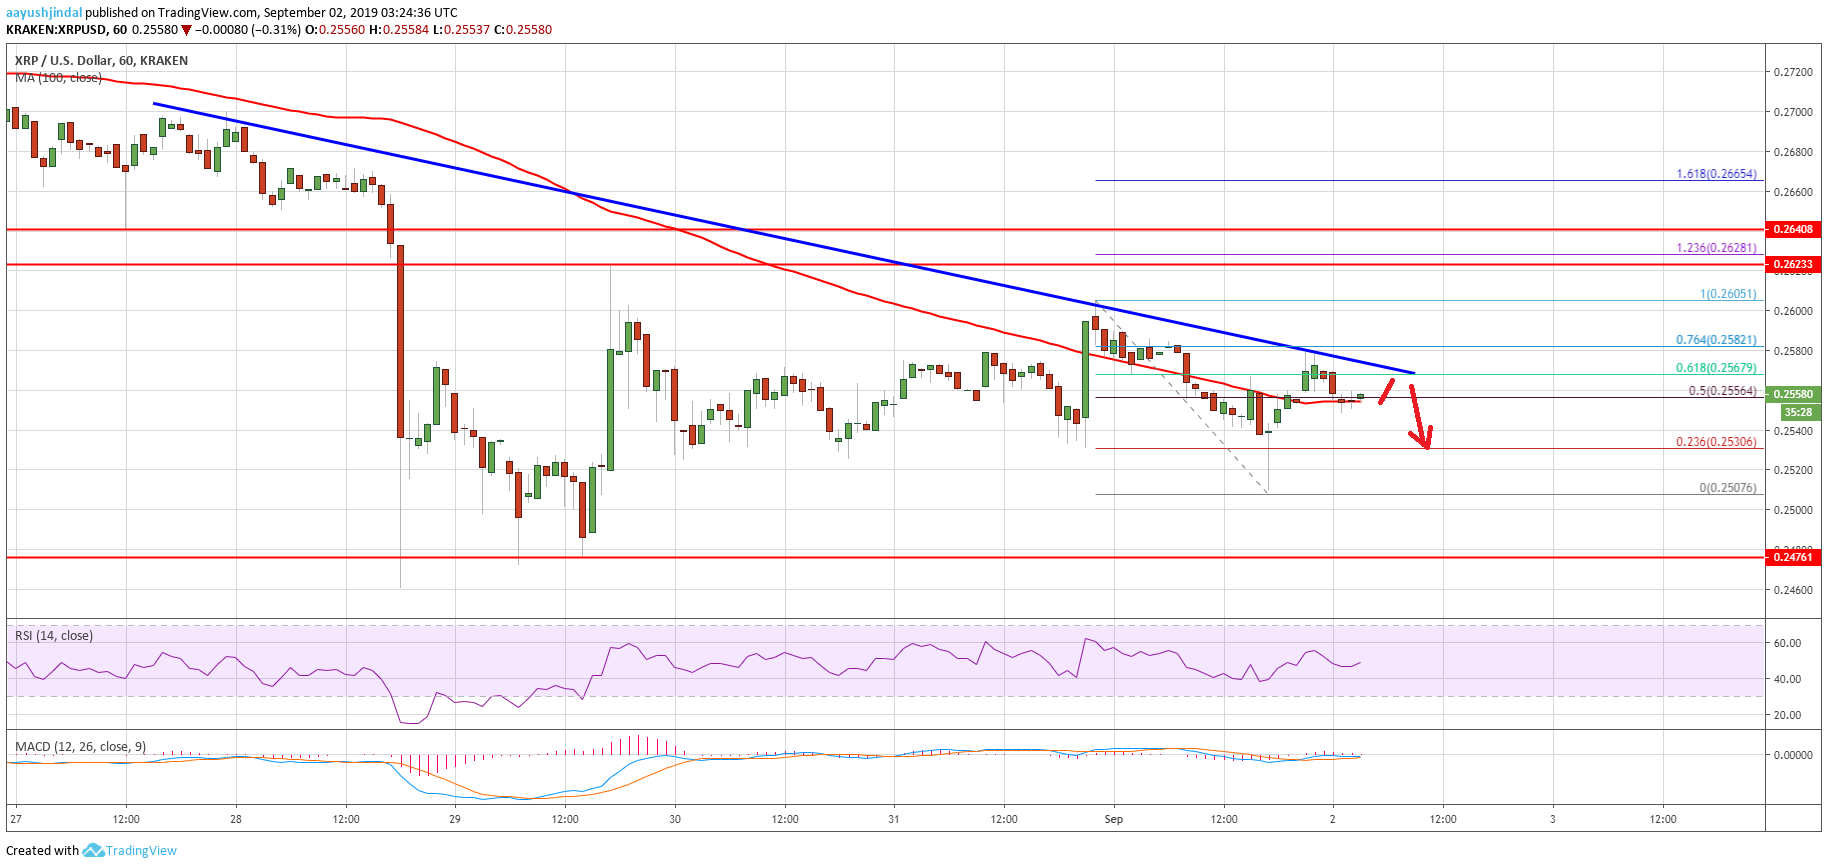
- Ripple price is trading in a downtrend below the $0.2600 and $0.2650 supports against the US dollar.
- The price is likely to extend its decline as long as it is below the $0.2650 level.
- There is a key bearish trend line forming with resistance near $0.2570 on the hourly chart of the XRP/USD pair (data source from Kraken).
- There could be an upside correction, but the price is likely to face sellers near $0.2600 or $0.2620.
Ripple price is facing a lot of hurdles on the upsides against the US Dollar and bitcoin. XRP price remains at a risk of more downsides unless it settles above $0.2650.
Ripple Price Analysis
This past week, we saw a significant decline in bitcoin, Ethereum and ripple against the US Dollar. XRP broke the key $0.2650 and $0.2600 support levels to enter a bearish zone. Moreover, there was a close below $0.2650 and the 100 hourly simple moving average. It opened the doors for more downsides and the price traded towards the $0.2500 level. A swing low was formed near $0.2460 and later the price corrected higher.
A decent support base was formed near $0.2475 and recently the price corrected above $0.2500. Moreover, there was a break above the $0.2550 resistance. However, the price struggled to gain momentum above $0.2600. The recent swing high was formed near $0.2605 and the price dipped back towards $0.2500. The recent low was formed at $0.2507 and the price is currently correcting higher.
It traded above $0.2550 plus the 50% Fib retracement level of the recent decline from the $0.2605 high to $0.2507 low. However, the $0.2580 level seems to be acting as a strong resistance. Additionally, ripple price failed near the 76.4% Fib retracement level of the recent decline from the $0.2605 high to $0.2507 low. More importantly, there is a key bearish trend line forming with resistance near $0.2570 on the hourly chart of the XRP/USD pair.
Therefore, an upside break above the $0.2580 and $0.2600 levels is needed for more upsides. The next key resistance is near the $0.2620 level (the previous support). Having said that, the price must break the $0.2650 resistance to move back into a positive zone.
Looking at the chart, ripple price is facing a lot of hurdles on the upside near $0.2600 and $0.2620. On the downside, an immediate support is at $0.2500. The main support is at $0.2475, below which the price could tumble towards $0.2400.
Technical Indicators
Hourly MACD – The MACD for XRP/USD is struggling to gain pace in the bullish zone.
Hourly RSI (Relative Strength Index) – The RSI for XRP/USD is currently near the 50 level.
Major Support Levels – $0.2520, $0.2500 and $0.2475.
Major Resistance Levels – $0.2580, $0.2600 and $0.2620.