
Reason to trust
How Our News is Made
Strict editorial policy that focuses on accuracy, relevance, and impartiality
Ad discliamer
Morbi pretium leo et nisl aliquam mollis. Quisque arcu lorem, ultricies quis pellentesque nec, ullamcorper eu odio.
- ETH price is currently correcting higher and is trading above $170 against the US Dollar.
- The price is likely to face a lot of hurdles on the upside near the $176, $178 and $180 levels.
- There is a connecting bullish trend line forming with support near $168 on the hourly chart of ETH/USD (data feed via Kraken).
- The pair might gain bullish momentum if it breaks the $174 level and the 100 hourly SMA.
Ethereum price is slowly correcting higher versus the US Dollar, similar to bitcoin. However, ETH price is likely to fail near the key $180 resistance area in the near term.
Ethereum Price Analysis
This past week, we saw a major decline in ETH price below the $180 support against the US Dollar. Moreover, there was a close below the $175 level and the 100 hourly simple moving average. Finally, the price traded to a new monthly low at $163. Later, the price started consolidating losses and it seems like a decent support base is forming near the $165 level.
Recently, Ethereum price started an upside correction above the $168 level. Moreover, there was a break above the 23.6% Fib retracement level of the downward move from the $188 high to $163 swing low. However, it seems like the price is struggling to surpass the 100 hourly simple moving average, currently at $172. If there is a break above the 100 hourly simple moving average, the price could recover towards $175.
The 50% Fib retracement level of the downward move from the $188 high to $163 swing low is positioned near the $175 level to act as a resistance. However, the main resistance on the upside is near the $180 level (the previous support area). A successful close above $180 is needed for a decent recovery in the coming sessions.
On the downside, an initial support is near the $168 level. Additionally, there is a connecting bullish trend line forming with support near $168 on the hourly chart of ETH/USD. If the pair breaks the $168 support, it could retest the key $165 support area. If there are more downsides below $165, the price could even break the $163 swing low and trade to a new low.
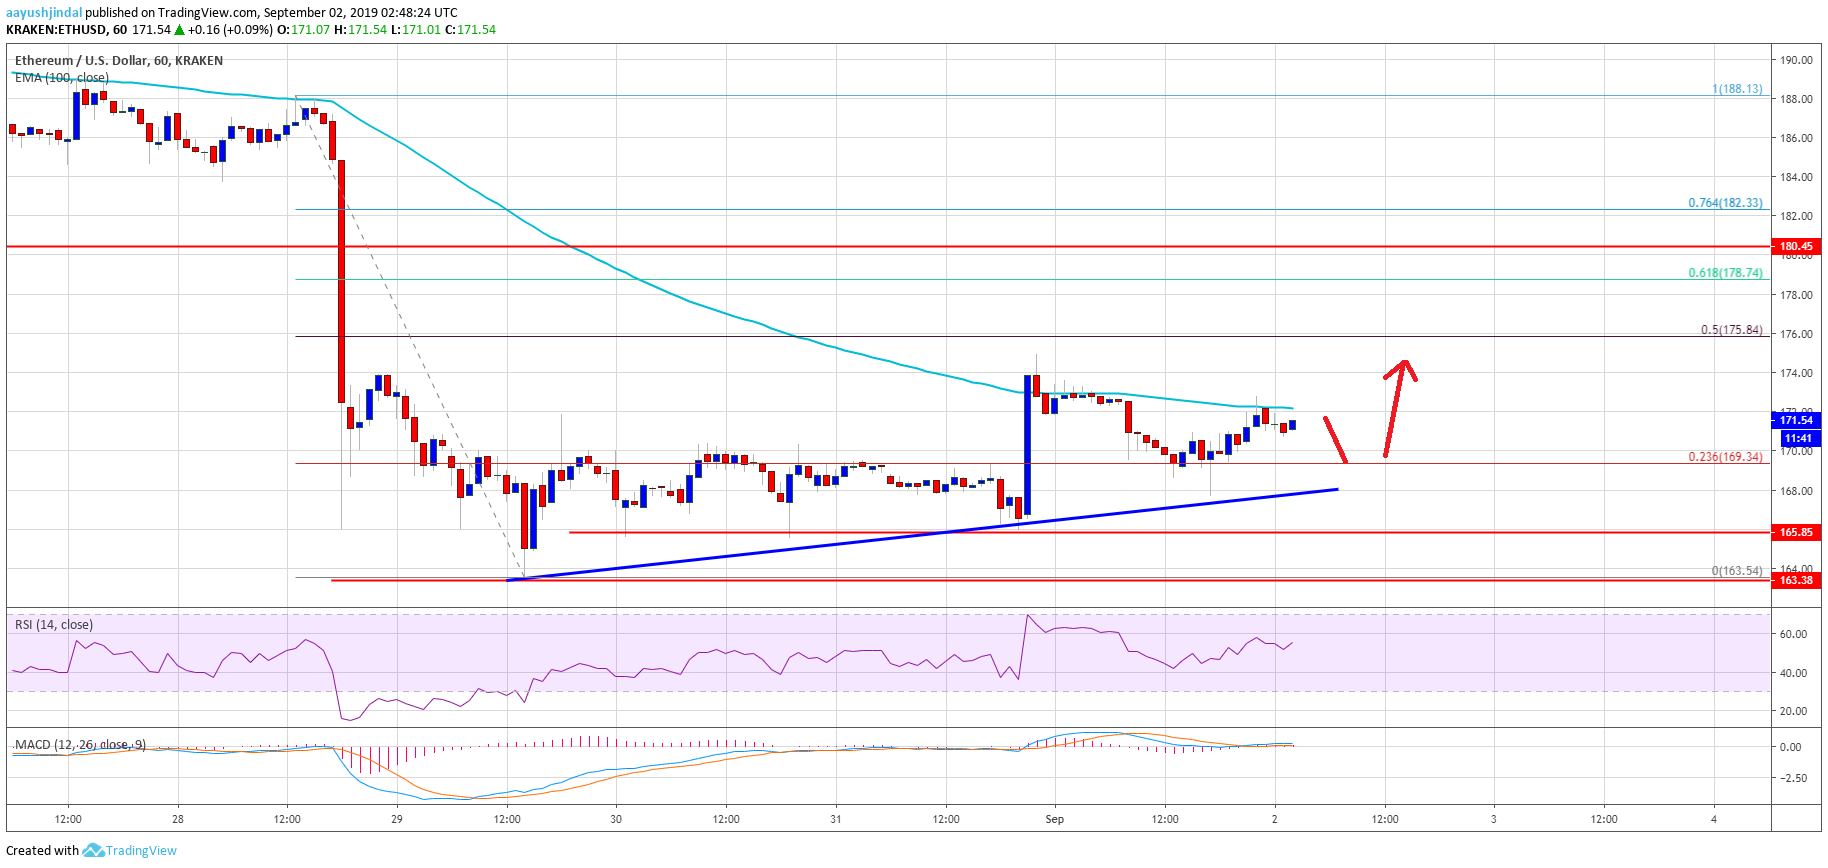
Looking at the chart, Ethereum price might gain bullish momentum if it breaks the $174 level and the 100 hourly SMA. However, it won’t be easy for the bulls to clear the $178-180 resistance area.
ETH Technical Indicators
Hourly MACD – The MACD for ETH/USD is slowly moving into the bullish zone.
Hourly RSI – The RSI for ETH/USD is currently above the 50 level, with a few positive signs.
Major Support Level – $165
Major Resistance Level – $175


