
Reason to trust
How Our News is Made
Strict editorial policy that focuses on accuracy, relevance, and impartiality
Ad discliamer
Morbi pretium leo et nisl aliquam mollis. Quisque arcu lorem, ultricies quis pellentesque nec, ullamcorper eu odio.
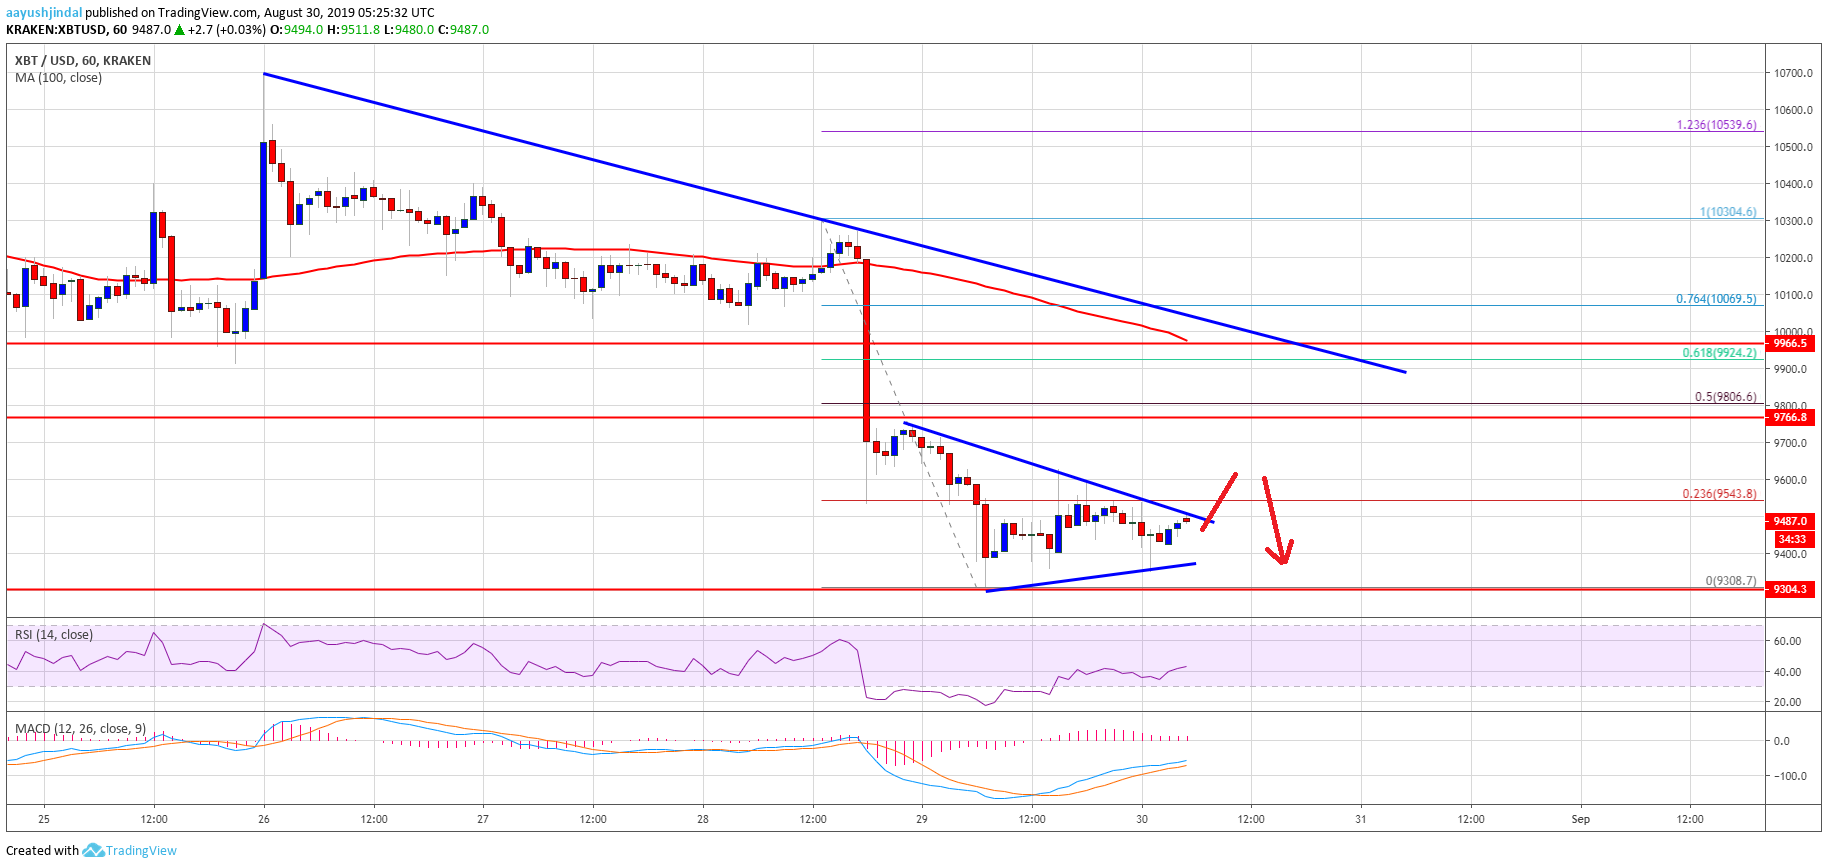
- Bitcoin price extended its decline and traded towards the $9,300 level against the US Dollar.
- The price is currently correcting higher, but it is likely to struggle near $9,600 and $9,760.
- There is a short term breakout pattern forming with resistance near $9,500 on the hourly chart of the BTC/USD pair (data feed from Kraken).
- The price is likely to resume its decline after a short term correction towards $9,760 or $9,800.
Bitcoin price is trading in a higher degree downtrend below $10,000 against the US Dollar. BTC remains at a risk of more downsides as long as it is below $10,000.
Bitcoin Price Analysis
Recently, we saw a bearish break below the $10,000 and $9,800 support in BTC against the US Dollar. The price even settled below the $9,760 support and the 100 hourly simple moving average. Finally, there was a break below the $9,500 support and the price extended its decline towards the $9,300 level. A swing low was formed near $9,308 and the price is currently correcting higher.
An immediate resistance is near the $9,500 level. Additionally, the 23.6% Fib retracement level of the recent decline from the $10,304 high to $9,308 low is also near the $9,500 level. More importantly, there is a short term breakout pattern forming with resistance near $9,500 on the hourly chart of the BTC/USD pair. Therefore, if there is an upside break above $9,500, the price could extend its upside correction.
The next key resistance is near the $9,760 level (the previous support). However, the main resistance is near the $9,800 level. It coincides with the 50% Fib retracement level of the recent decline from the $10,304 high to $9,308 low. To move back in a positive zone, the price must break the $10,000 resistance and the 100 hourly simple moving average.
On the downside, an initial support is near the $9,400 level. If there is a downside break below the $9,400 and $9,300 levels, the price could extend its decline. The next target for the bears could be near the $9,000 level. An intermediate support is near the $9,200 level.
Looking at the chart, bitcoin price is clearly trading in a higher degree downtrend below $10,000. In the short term, there could be an upside correction above $9,500 and $9,600. However, the bulls are likely to face a lot of hurdles near the $9,760 and $9,800 level. The main hurdle is near the $10,000 pivot level.
Technical indicators:
Hourly MACD – The MACD is slowly gaining pace in the bullish zone.
Hourly RSI (Relative Strength Index) – The RSI for BTC/USD is recovering towards the 50 level.
Major Support Levels – $9,400 followed by $9,300.
Major Resistance Levels – $9,600, $9,760 and $9,800.